Garis besar topik
-

-
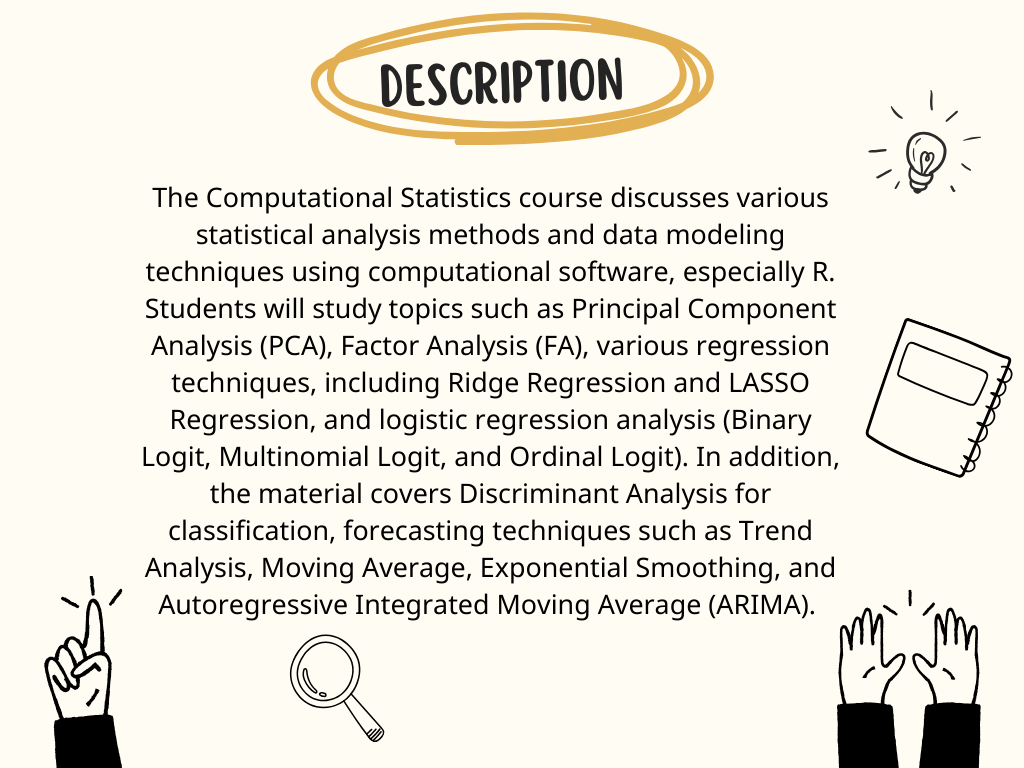
- Principal Component Analysis (PCA)
- Factor Analysis (FA)
- Best Subset Regression
- Stepwise Regression
- Ridge Regression
- LASSO Regression
- Principal Component Regression (PCR)
- Logit Biner
- Logit Multinomial
- Logit Ordinal
- Discriminant Analysis
- Trend Analysis
- Moving Average
- Exponential Smoothing
- Autoregressive Integrated Moving Average (ARIMA)
-
Principal Component Analysis (PCA) is a statistical technique used to reduce the dimensionality of data with the aim of simplifying datasets that have many variables without losing important information. PCA works by identifying patterns in the data and finding the ΓÇ£principal componentsΓÇ¥ that represent the greatest variation in the dataset. In this way, PCA helps transform high-dimensional data into lower-dimensional data, making it easier to analyze, visualize, and apply machine learning algorithms to complex datasets. This technique is particularly effective in dealing with data that has correlations between variables, as PCA can reveal hidden structures in the data.
-
-
Siswa harusTandai selesai
Silahkan Jawab Pertanyaan Berikut:
- Apa peran utama PCA dalam reduksi dimensi data, dan mengapa metode ini sering digunakan dalam analisis data yang kompleks?
- Bagaimana cara kerja PCA dalam mengidentifikasi komponen utama? Mengapa komponen utama pertama selalu memiliki varians terbesar dalam dataset?
- Dalam konteks feature selection, apa perbedaan antara PCA dan metode seleksi fitur berbasis korelasi? Kapankah PCA lebih disarankan?
- Bagaimana dampak skala fitur terhadap hasil PCA, dan mengapa penskalaan data menjadi langkah penting sebelum melakukan analisis PCA?
- Dalam penerapan PCA, bagaimana kita menentukan berapa banyak komponen utama yang harus dipertahankan? Apa kriteria yang digunakan untuk memilih jumlah komponen tersebut?
-
-
-
-
Factor Analysis is a statistical method used to identify hidden structures in complex data sets by grouping correlated variables into fewer factors. The main goal is to reduce the dimensionality of the data while retaining important information, thus allowing researchers to understand the patterns of relationships between variables and identify underlying latent factors. This technique is often used in the fields of psychology, education, marketing, and social sciences to simplify data and aid the interpretation of research results.
-
-
Siswa harusTandai selesai
Upload the results of the Review Paper typed and uploaded in Ms. Word format.
-
-
-
-
Best Subset Regression is a method in regression analysis used to select the best combination of predictor (independent) variables that are most relevant in predicting the response (dependent) variable. In Best Subset Regression, the model is built by considering all possible combinations of predictor variables, then the best model is selected based on certain criteria, such as Adjusted R-squared, AIC (Akaike Information Criterion), BIC (Bayesian Information Criterion), or MSE (Mean Squared Error). This method is very effective in finding the simplest model while still having optimal predictive performance, thus helping to avoid overfitting problems and ensuring that only significant variables are used in the regression model.
-
-
Stepwise Regression is a statistical method used to select the most significant independent variables in a regression model iteratively. The process involves adding or removing variables one by one based on certain criteria, such as p-value, Adjusted R-squared, or Akaike Information Criterion (AIC). The goal is to find the optimal regression model with the most relevant predictor variables, thus improving the accuracy and interpretability of the model. This method is useful when we have many variables and want to identify the ones that have the most influence on the dependent variable.
-
-
Ridge Regression is a regression method used to address multicollinearity issues in linear regression models, where the independent variables are highly correlated with each other. This technique adds a penalty to the size of the regression coefficients, thereby reducing model complexity and preventing overfitting. This penalty is determined by the lambda (╬╗) parameter, which controls the amount of penalty imposed. The larger the value of ╬╗, the smaller the regression coefficients, resulting in a simpler and more stable model. Ridge Regression is particularly effective when we work with data that has many variables and high multicollinearity.
-
-
Lasso Regression (Least Absolute Shrinkage and Selection Operator) is a linear regression technique that combines feature selection and regularization to improve model accuracy and prevent overfitting. Lasso works by adding a penalty equal to the absolute sum of the regression coefficients (also known as \(L_1\) regularization) to the loss function. This penalty effectively drives some coefficients to zero, thus retaining only the most important features in the model.
-
-
Principal Component Regression (PCR) is a statistical technique that combines Principal Component Analysis (PCA) with linear regression. PCR is used to overcome the multicollinearity problem in linear regression by reducing the dimensionality of the data. The process begins by applying PCA to identify the principal components that explain the greatest variation in the data. Then, linear regression is applied to these principal components to predict the dependent variable. PCR is particularly useful when the data has many correlated features or when the dimensionality of the data is too high.
-
-
Midterms are not the end of the journey, but a step towards success. Believe in yourself, because you have worked hard until now. Face the exam with confidence and calmness. Remember, the best results always come from tireless efforts. Good luck, may the results you achieve match your expectations!
-
-
Binary Logit is used in logistic regression models to model the probability of outcomes that have only two categories (binary), such as yes/no or success/failure. It is based on a logistic function that relates the independent variables to the probability of one of the two outcomes occurring.
Multinomial Logit is used for cases where the dependent variable has more than two categories, which are not necessarily consecutive. This model generalizes binary logistic regression to more categories (for example, choosing between three or more options) by using the log odds for each category compared to the reference category.
-
Ordinal Logit is a model used for dependent variables that have sequential (ordinal) categories, such as ratings (very poor, poor, good, excellent). This model assumes that there is an order within the categories, and the main objective is to predict the probability of the response falling within each ordinal category. One commonly used approach is the Proportional Odds Model, which assumes the same relationship between ordinal categories for each unit change in the independent variable.
-
Discriminant Analysis is a statistical technique used to model and analyze data with more than two group categories (multiclass). This technique is used to predict the membership of an object or individual into one of several categories based on known feature values. One well-known method is Linear Discriminant Analysis (LDA), which attempts to find a linear combination of features that maximizes the separation between groups. Discriminant analysis is often used in classification and predictive analysis, such as in risk identification or disease classification.
-
Trend analysis is a technique used to identify patterns or trends in time series data. The main goal is to detect long-term movements or directions, such as growth, decline, or stability, in a particular dataset. This analysis helps in understanding the underlying pattern of the data over time and is essential for making informed forecasts. Trend analysis often involves visualizing the data using graphs to discern these long-term movements, which could be linear, exponential, or cyclical in nature. It is widely used in economics, business forecasting, and stock market analysis to predict future behavior based on observed trends.
-
Moving Average is a statistical method used to smooth out short-term fluctuations in time series data by averaging a set of data points over a specific period. This helps to highlight the underlying trend by reducing the noise or randomness in the data. The simplest form is the Simple Moving Average (SMA), where the average of a fixed number of past observations is taken to predict the next value. There is also the Weighted Moving Average (WMA), where more recent data points are given higher weights, making them more influential in the average calculation. Moving averages are particularly useful for detecting trends in stock prices, weather data, or other financial and economic metrics.
-
Exponential Smoothing is a forecasting technique that assigns exponentially decreasing weights to past observations. The most recent data points are given more weight, while older observations lose their significance more quickly. This method is well-suited for time series with no clear trend or seasonal patterns, though it can be adapted to handle both. The basic form of exponential smoothing is called Single Exponential Smoothing, but there are more advanced versions, such as Double Exponential Smoothing (which accounts for trends) and Triple Exponential Smoothing (which incorporates seasonality). Exponential smoothing is favored in forecasting because it is easy to implement, requires minimal data processing, and performs well when trends or seasonal components are not too strong.
-
ARIMA is a powerful and widely used time series forecasting method that combines three components: Autoregressive (AR), Integrated (I), and Moving Average (MA). The Autoregressive (AR) component models the relationship between an observation and a number of lagged observations. The Integrated (I) component involves differencing the data to make it stationary, meaning the mean and variance do not change over time. The Moving Average (MA) component models the relationship between an observation and the residual errors from previous observations. ARIMA is suitable for datasets that do not exhibit seasonal patterns but may contain trends or other non-random fluctuations. It is often used when data exhibits autocorrelation, where past values influence future ones. ARIMA models are particularly useful in fields such as finance, economics, and environmental data forecasting.
-
Siswa harusTandai selesai
Silahkan upload Artikel, bukti submit dan Metadata artikel ketika submit.
Setiap orang mengupload masing-masing di LMS nya.
-
-
A final exam is an important assessment given at the end of a course to evaluate a student's overall understanding of the material. It typically covers all the topics studied during the semester and often holds significant weight in determining the final grade. The exam can take various formats, including multiple-choice, short answer, essay questions, and problem-solving tasks. To prepare, students should review their notes, practice with past exams, and manage their study time effectively. During the exam, it's important to read instructions carefully, pace yourself, and answer easier questions first. The final exam helps assess how well students have grasped key concepts and serves as a major component of their overall grade in the course.