Garis besar topik
-
-
Siswa harusTandai selesai
Assalmualaikum wr wb
Welcome to the course in Business Research Methods. During one semester you will study business research methods from designing, conducting field research, analyzing and writing research results, both qualitative and quantitative research.
The course equips students with theoretical and practical knowledge about the process of conducting research, from formulating business problems to research problems, making literature reviews, compiling research models and hypotheses, operationalizing the concepts used in hypotheses, compiling research instruments, taking samples, and researching in the field to analyzing data from field research results, including techniques in finding research gaps
Best regards,
Dr. Faurani Santi Singagerda
-
Siswa harusTandai selesai
To find out the RPS and syllabus of this Business Research Methodology course, you are able to download the following files:
-
Siswa harusTandai selesai
Hii fellas...
You may download the e-book from Uma Sekaran, just click the link:
https://drive.google.com/drive/folders/1aRNB5p1i379ODAYmyA_LRxvWVBsn-7mr?usp=sharing
Hopefully, will be helpful
-
Siswa harusTandai selesai
The assessment consists of:
Assignment: min 3 times ( 2 before mid and 1 after midtest) : 20 Percent
Midtest: 30 percent
Final Test: 35 Percent
Activity (attendance plus activity in forum/virtual): 15 percent
-
-
-
Siswa harusTandai selesai
1. Students have the ability to understand the meaning of knowledge and sources of knowledge
2. Students understand the basic principles of scientific research
-
-
Siswa harusTandai selesai
This time, I will open a question and answer forum regarding the Business Research Methods:
Please you can discuss:
1. What is business research? And to what extent has research been used in the industrialized world so far?
2. How do you think about and the role of research in your job/profession
3. How do you find a problem in the research that you will do later
4. Why is theory and information very important in conducting research?
-
Siswa harusTandai selesai
Today's business has become very complex. Various factors interact with each other and make business unpredictable. On that basis, a systematic method is needed in dealing with various problems that arise in the business, namely the business research method.
Business Research Methods
The business research method is a systematic method that is useful for researching various aspects related to business. This method largely shares the same solution idea as other scientific research methods. In this method, the explanation and steps to solve the problem must be logical and systematic.
Logical means that the conclusions that exist must be based on facts in the field, not mere inspiration. Systematic means that the way the research works is structured according to other scientific research methods.
In addition, the research must be proven and repeated by others. The pattern of drawing conclusions in business research can be divided into two types, namely deductive and inductive. The deductive conclusion method can be done by drawing specific conclusions from general facts. Meanwhile, in contrast to the deductive method, the inductive method draws conclusions from specific facts.
For example, you want to find out why the productivity of your workers is decreasing. You are looking for general facts, such as the number of outputs your workers make per day. From there it is then sought why the decline occurred.
Types of Business Research Methods
According to the type of data, business research can be divided into two, namely qualitative research and quantitative research. Both types of research can be carried out depending on the type and purpose of the research to be carried out. Therefore, research planning is very important to do. Researchers will plan in advance about the goals and objectives of the research.
The aims and objectives of the research are then derived into the research methods to be carried out. In tracing this research method, the types and needs of the data are defined. What is the amount of data, who are the samples needed in the study, and the type of data to be used must be defined in this phase?
1. Qualitative Methods
Qualitative research methods are research methods that use data other than numerical data. This means that the data used does not contain numbers. The data used is for example grouping data into several categories. An example of business research that falls into the qualitative category is tracing whether consumers know what products are on the market and what they think about these products.
2. Quantitative Methods
In contrast to qualitative methods, quantitative methods use numbers as their research approach. Data commonly used in this type of research is usually expressed in numbers or numerics, such as ratio data.
Marketing Research
Start a business plan with a simple initial plan. The initial plan includes a summary, mission statement, keys to success, market analysis, the balance of funds analysis, and so on. These are the simplest business plans.
A business plan has a standard, which follows the advice of business experts, covering a set of standard elements, such as a description of the company, product or service, target market, forecasts, management team, and financial analysis.
A business plan depends on the situation. The business plan will run as it should if the internal situation of the company and the external situation support it. The existence of investors or investors can affect the continuity of a business plan.
In making a business plan, we must know and recognize the existence of a position, goals, and what we want to achieve in the business that was built, so that we can be successful. As for success, there is a raw material. The ingredients for success is ability, effort, attitude.
As a business philosophy, the marketing concept has the aim of providing satisfaction with consumer desires. In addition, the marketing concept is oriented towards consumer needs. The marketing concept is different from the previous business concepts which were oriented towards products and sales. The marketing concept consists of three elements, namely as follows.
Oriented to consumers. In marketing management, you have to see what the sales target of your product is like, so you need to know the consumer first.
Arrangement of detailed marketing activities. If you have found the right consumer or marketing target, then you just need to formulate a sales strategy for the product. Break down your marketing activities in detail.
Consumer satisfaction. If your sales activities are already running, then you need to evaluate your product marketing management, such as customer satisfaction with the products you sell. So, you can find out the shortcomings of these products, so you can strategize so that your products remain in demand in the market.
Marketing management cannot be separated from the four main factors that greatly influence the course of a marketing management. Here are four factors that influence the marketing business.
1. Product
The products of a company are divided into two types, namely products in the form of goods (such as cell phones, motorbikes, and clothes) and products in the form of services (such as savings, telecommunications services, or body care and spa services.
In the product concept, there are premium products or products that have distinctive features, unique features, and have a class of their own. Therefore, these products have a relatively expensive price. Meanwhile, on the other hand, there is also a "me too" product concept, which is a product that is designed as a competitor or an imitator of products that are already on the market.
To market a product, you need to look at the sales goals of your product to whom, where, and when. You need a strategy that you have to do so that the products you sell well in the market. Even though the product you are selling is an imitation item, if you offer the product to the right consumer, at the right time and place, then your product sales will be selling well.
2. Promotion
Promotion is a step that needs to be taken to introduce a product and persuade potential customers to spend money to buy the product offered. In promotion, it is known as the promotion mix or combination of promotional programs which are incorporated into four key elements, namely promotion through advertising, promotion of publications, promotion through sales promotion, and promotion through personal selling.
As a consumer, of course, the promotion of goods really influences him to be interested in buying an item. A good and attractive promotion can attract consumers to buy it. However, promotions must also be carried out at the right time and place. If you are promoting a jacket in hot regions and in the summertime, that is not quite right. The sales of your goods will be low or no one will even buy them. For that, the promotion of a product also needs a strategy.
3. Place
Place means the place where the product being offered will be sold or marketed. Place concerns the distribution strategy to be carried out. There are three distribution models, namely exclusive distribution, selective distribution, and intensive distribution. Exclusive distribution is marketing goods and services only to limited outlets in order to maintain the prestige and reputation of the products offered. For example, Jogger T-shirts that are sold and marketed in only one location or Audemar Piaget's watches which are only marketed at certain outlets.
Selective distribution is a series of products that are only sold or marketed in modern outlets or modern markets and are not sold in traditional markets. Meanwhile, intensive distribution is a product that is marketed or sold to all types of markets, both modern and traditional, and covers all parts of Indonesia.
4. Pricing
Pricing is a strategy that involves setting product prices. As explained above for products with strong differentiation, a premium price can be charged. For example, a Harley Davidson or a Porsche. In addition, there are products that are sold with a low-cost strategy, for example, the telephone services offered by CDMA operators.
Pricing for a product has a purpose. Basically, there are four types of pricing goals. This is the purpose of product pricing by a company or seller. Pricing is carried out to generate the highest profit (profit maximization), so that the company or seller chooses the price of its product that can generate large profits.
Pricing is done to achieve a high level of sales volume within a market share. Pricing is carried out to form a company image, such as by setting a high price on a product it can form a prestigious corporate image.
-
-
-
Siswa harusTandai selesai
Students:
1. Have the ability to understand the process and steps in carrying out scientific research
2. Students are able to choose theory as a basis for conducting research
3. To identify and develop research problems
4. Find the research gap as problems
5. Use the Citation method as references
6. Using the reference manager
-
Siswa harusTandai selesai
1. To help participants comprehend that scientific research offers assurance to the manager that the results of a study can be relied upon and further action can be taken at low risk.
2. To impress on the students that business research, however rigorously conducted, cannot produce 100 percent scientific results in terms of precise solutions.
3. To sensitize participants to being watchful about observing the different cues in the environment which offer some idea of a gap in the desired and actual state of affairs.
4. To help students understand that applied research, though limited in generalizability, still has to be ΓÇ£scientificΓÇ¥.
Scientific Method
A structured way of investigating and explaining the operation of the world by testing and verifying hypothesized relations. The scientific method is a process of discovery, a method of explaining the way the world operates. Positive economics is the application of the scientific method to economic analysis.
The scientific method is the process used to study, explain, and analyze economic phenomena. It helps make sense of the seemingly chaotic events of economic life. The price of gasoline rises. Why? A local factory lays off a hundred employees. Why? The President proposes a tax cut to stimulate the economy. Why?Answering these questions, and thousands of others, is what the scientific method is all about.
Explaining Things
The scientific method seeks to explain the mechanisms of the world, how things work. Science seeks to identify the basic laws of nature that govern the world. More to the point, economic science, or positive economics, seeks to explain how the economic world works, to identify the economic laws of nature.It is one thing to attribute the daily movement of the sun across the sky to the efforts of a Greek god. It is quite another to explain this movement using gravity and planetary orbits.
The great thing about the ability to explain is the resulting ability to predict. Knowing that the sun's movement is guided by the law of gravity makes it possible to predict its position tomorrow, next week, or next year. This information helps when doing things like flying to the moon.
Components of the Method
A little more insight into the scientific method can be had with an overview of several key components--theory, principles, world view, hypothesis, and verification.- Theory: The starting point, but also the end result, of doing science is the theory. A theory is a scientifically accepted, interrelated body of general principles used to explain and understand some aspect of the world. A theory creates a framework for investigating and explaining the world. It helps make sense out of what might appear to be random events. A theory offers an explanation for these events. It explains WHY things happen.
- Principles: Principles are generally accepted, verified, fundamental laws of nature. As a house is constructed from concrete, lumber, and nails, a theory is constructed from principles. To be a fundamental law of nature, a principle must capture a cause-and-effect relation about the workings of the world. One example might be something like, "people seek the greatest benefit at the lowest cost." The scientific method is essentially the process of building theories by identifying and verifying these fundamental laws of nature.
- World View: A world view contains fundamental, and unverifiable axioms, beliefs, and values about how the world works. Religious beliefs, political philosophies, and cultural conditioning are just a few of the components that go into a person's world view. These components are largely "accepted on faith" and cannot be tested or verified directly. Without a doubt, the best example of a world view component is the belief in God--a supreme, omniscient, omnipotent being. Another example is the presumption that human beings are basically good (as opposed to basically evil). These beliefs cannot be directly verified and must be accepted on faith.
- Hypotheses: Principles are the end result of a long, scrutinizing process that starts with hypotheses. A hypothesis is a reasonable proposition about the workings of the world that is inspired or implied by a theory and which may or may not be true. Hypotheses are generated from informed ignorance--informed, because they are implied by a theory that has been previously subjected to a great deal of scrutiny, but ignorance, because no one yet knows if the hypothesis is right.
- Verification: This gives rise to the fifth and last part of the scientific method, verification. To know if a hypothesis is right or wrong, comparison is made with data, empirical observations drawn from the real world. The scientific method is ultimately concerned with explaining the workings of the real world. Perhaps a Greek god carries the sun across the sky. Perhaps the sun's apparent trek across the sky is caused by the rotation of the earth. Both are hypothesized relations for the perceived motion of the sun. Which is correct? The only way to know is through verification and testing--to compare the hypotheses with what actually happens in the real world.
Verifying hypotheses with real world data is the crucial step in transforming a hypothetical relation into a fundamental law of nature--a principle. A hypotheses must pass the real-world-data test to become a principle. And this is the scientific method.
More than a Subject, a Process
The scientific method is a process, a way of explaining the world. It is more than a subject taught by people in lab coats. While chemistry, physics, and biology are most often associated with science--subjects termed physical science--the scientific method is also used for the study of society and human behavior. Economics is a science, a social science, the scientific study of society.In fact, science is more than a subject. It is a process. The scientific method can be applied to a wide range of subjects, including things like human behavior, the economy, and, in general, society. This scientific study of society gives rise to the social sciences. That is where economics can be found. It is a social science, the scientific study of society.
Science, whether physical or social, differs only in WHAT it studies, not HOW it studies. Science is not a specific subject, but a way of viewing the world. And this process, this scientific method, is the topic of the day.
A Word About Values
Even though the scientific method seeks to objectively explain real world events, it is not completely value free. Subjective values play a role in the scientific method, especially when applied to economics.- First, subjective values often enter into the unverifiable axioms and world view that make up a scientific theory. Scientists tend to (unwittingly in some cases) develop theories that reflect their own subjective political, cultural, or religious beliefs.
- Second, subjective values often influence the specific topics studied using the scientific method. The topics that someone subjectively deems to be more important to attract scientific resources, others do not.
-
Siswa harusTandai selesai
Leraning Outcomes:
1. To clarify to the students that though the Research Process has distinct phases, some of the steps follow an iterative, rather than a linear process. For example, the problem statement could be redefined after the theoretical a framework is conceptualized, after data analysis, and in fact, at any of the stages in the process.
2. To illustrate that identifying the Broad Problem Area sets the stage for focusing on literature search and subsequently clearly defining and refining the problem.
3. To emphasize that preliminary data collection through interviews offers a great opportunity to narrow down the problem.
4. To develop interviewing and problem identification skills in students.
5. To create a mindset in students of viewing a problem as a gap between desired and actual state of things in a system, and a solution as narrowing this gap.
6. To encourage students to develop bibliographies by accessing available on-line data bases.
Research Gap
Research gaps are the results of efforts to identify gaps or areas of knowledge that are either empty or need to be filled with new insights or knowledge through research. Empty areas or gaps can be topics that are poorly understood, or there are insufficient knowledge and information that prevents us from finding answers or conclusions to a problem or question.
How to find research gaps, let's see the following impressions:
-
Siswa harusTandai selesai
How to find the problems in research? And how to make a good problem statement?
Kindly submit your answer using system in LMS before 18 Oct 2020 (time 10.30)
-
Siswa harusTandai selesaiDefinition of citations
Citation is defined as a bibliography of a number of documents referred to or cited by a document and each bibliography of these documents is contained in the bibliography of the citing document, which specifically examines the author and other works. Citations can also be interpreted as intellectual references to published or unpublished sources by citing a book, author or publication that exists to support the facts.
Understanding Citation According to Experts
The definitions of citations according to experts are as follows;
1. Diana Hacker and Nancy Sommers
Diana Hacker and Nancy Sommers in ΓÇ£A Pocket Style Manual, Eighth EditionΓÇ¥ suggest that citations are a way you can appreciate other researchers and writers when you use their work in your writing.
2. Garfield
Citation analysis is widely used in bibliometric studies because it clearly represents the required subject, does not require interpretation, is valid and reliable.
3. Guha
Guha mentioned several secondary uses of citations, including 1) Used as a bibliography, 2) Preparing magazine ranking lists, 3) Used as ranking lists, 4) Knowing the relationship between the use of various forms of documents, 5) Knowing the age of use of documents, 6) Knowing the relationship and the relationship between subjects, 7) Knowing the origin or roots of the subject of science, and 8) Study of abstract / index citations.
Types of Citation Sources Used
The citation content may vary depending on the type of source used, which may include:
- Book, Book title, publisher, date of publication, page number, International Standard Book Number (ISBN).
- Journal, Author, title in terms of the article, journal title, publication date, page number.
- Newspaper, Author, article title, newspaper name, section title, and page number if desired, publication date.
- Website, Author, article and publication title, URL, date when the site was accessed, Digital Object Identifier (DOI).
- Rhymes, slash spaces are usually used to indicate separate lines of a poem, and parenthetical quotes usually include the line number.
Along with typical information about the author, publication date, title, and page number, citations also include a unique identifier that is often used for certain types of reference work:
- International Standard Book Number (ISBN): Used for book excerpts.
- Serial Item and Contribution Identifier (SICI): Used for specific volumes, journal articles, or other sections of a magazine.
- Digital Object Identifier (DOI): Used for documents and electronic sources.
- PubMed Identifier (PMID): Used for articles of biomedical research results.
Type of Citation
Citations are a way of rewarding individuals for the creative and intellectual work you use to support your research report. It can also be used to find specific sources and combat plagiarism.
The citation style determines what information is required in a citation and how it is written, as well as punctuation and another formatting. Then, how do you choose the right citation style?
There are many ways to cite sources for your research approach. The style of citation sometimes depends on the academic discipline involved. As an example:
1. The APA (American Psychological Association) style is used in the fields of Education, Psychology, and Science
2. The MLA (Modern Language Association) style is used in the Humanities field
3. The Chicago / Turabian style is commonly used in Business, History, and Fine Arts.
Apart from these three styles, there are also other types of styles, namely: Oxford; Harvard; ASA (American Sociological Association); AAA (American Sociological Association); CSE (American Sociological Association); CBE (American Sociological Association).
The form of citation generally refers to one of the generally accepted systems of citation, as mentioned above, because its syntactic conventions are well-known and easily interpreted by readers. Each of these citation systems has advantages and disadvantages. The editor often determines which citation system to use.
Purpose of Citation
The citation has several important objectives, including the following;
1. To uphold intellectual honesty (or avoid plagiarism)
2. To link previous or unoriginal works and ideas with the correct sources
To allow the reader to independently determine whether the material being referenced supports the author's argument through his claim
To help readers measure the strength and validity of the material the author has used.
How to Create Citations
You can incorporate other people's work into your writing in three ways, namely:
1. Quote
The citation must match the source used. Only quote phrases, lines, or sections that are relevant to your subject and do not change the spelling or punctuation of the original quote.
2. Paraphrase
Paraphrasing engages you in writing, phrase by phrase from your source rewriting it into your own words. Your section must be the same length or shorter than the original. Paraphrasing means a complete rewrite of the source part used and not just a rearrangement of words.
3. Summarize
Summarizing includes putting the main idea of ΓÇïΓÇïpassage into your own words. The summary is much shorter than the original source section. Make sure not to change the true meaning of this passage while summarizing the main ideas.
In more detail, here is how to compose a citation based on the three most widely used citation styles, namely the APA, MLA, and Chicago styles.
1. APA Style Citation
There are two citation sections for APA style and another, the short in-line citation form, which leads the reader to a full entry at the end of a chapter or book. Inline citations are different from footnotes, which are notes that are placed at the bottom of the page.
In-line citations, also called in-line citations, are placed within one line of text. To create an in-line citation, cite the author's name and date (in brackets) of the article, report, book, or study, as this example from ΓÇ£A Pocket Style ManualΓÇ¥ shows: Cubuku (2012) argues for a student performance-centered approach, students should maintain ΓÇ£ownership of their goals and activitiesΓÇ¥ (p. 64).
Notice how you put the page number at the end of the in-text citation in parentheses followed by a period (if at the end of a sentence). If there are two authors, state their last name, as follows: "According to Donitsa-Schmidt and Zurzovsky (2014), ..." If there are more than two authors, write the first author's last name followed by the words "et al.", For example Herman et al. (2012) tracked 42 students over a three-year period (p. 49).
At the end of your paper, attach one or more pages to write "Reference". Your paper reader can then open the list of references to read the full citation for each work you cite. There are actually many variations to citation references depending on, for example, whether you are citing a book, journal article, or story from a newspaper, or different types of media, including audio recordings and films.
The most common quotes are books. For such a quote, write the author's last name, followed by a comma, followed by the author's first initial, followed by a period. You would put the year the book was published in brackets, then the book title in italics, followed by a period, where it was published, followed by a colon, and the publisher. ΓÇ£A Pocket Style ManualΓÇ¥ provides an example of this: Rosenberg, T. (2011). Join the club: How peer pressure can transform the world. New York, NY: Norton.
2. MLA Style Citation
The MLA style is often used in English and humanities writing. MLA follows the style of in-text author citation, Purdue OWL notes, an excellent citation, grammar, and writing site operated by Purdue University. Purdue provides examples of in-text citations, which are also called brackets in MLA style. Note that in MLA style, page numbers usually don't appear unless the sentence or quote is a direct quote from the original, as is the case here: Romantic poetry is characterized by "the spontaneous outpouring of strong feelings" (Wordsworth 263).
At the end of the paper, attach a page for ΓÇ£Works CitedΓÇ¥ or the equivalent page for the ΓÇ£ReferencesΓÇ¥ section in APA style. The ΓÇ£Work CitedΓÇ¥ section of the citation is very similar in style to MLA and APA, as in the example of work by multiple authors from Purdue OWL: Warner, Ralph, et al. How to Buy a House in California. Edited by Alayna Schroeder, 12th ed., Nolo, 2009.
Write the author's first name in MLA style; add a comma before "et al."; use the title of a book, journal, or article title; remove places for publication information; follow the publisher's name with a comma, and include the date of publication at the end.
3. Chicago Style Citations
The Chicago-style citation is the oldest of the three major writing and citation styles in the United States, having started with the publication of the first Chicago style guide in 1906. For in-text citation, Chicago style, derived from the University of Chicago's ΓÇ£Chicago Manual of StyleΓÇ¥ Press, is quite simple: the author's last name, publication date, comma, and page number, all in brackets, as follows: (Murav 2011, 219-220) At the end of the paper, include a list of references, which in Chicago style is called a bibliography. Books, journals, and other articles are cited in a manner similar to APA and MLA style.
Include the author's last name, comma, and full first name, followed by the book title in italics, place of publication, followed by a colon, followed by the publisher's name, comma, and publication date, all in parentheses, followed by a comma and page number. Kate L. Turabian, in ΓÇ£A Manual for WritersΓÇ¥ (Chicago version for students), gives the following example: Gladwell, Malcolm, The Tipping Point: How Little Things Can Make a Big Difference (Boston: Little Brown, 2000), 64-65.
Use of Reference Manager in Citation Techniques
References Manager or Citation Management Tools In addition to the risk of plagiarism due to the copy and paste culture, technological developments have also made it easier for writers to quote or cite through various application programs.
This application program, which is commonly called the References Manager or Citation Management Tools, can be easily found and used by writers, both free and paid. Some examples of applications or software include:
a. Mendeley Reference Manager (www.mendeley.com)
b. Zotero (www.zotero.org)
c. EndNote (endnote.com)
d. RefWorks (www.refworks.com)
e. Reference Manager (www.refman.com)
f. CiteULike (www.citeulike.org)
In addition to making citations with certain styles or models that are commonly used, the references manager application has also been developed so that authors and researchers can collaborate with other authors or researchers, looking for sources of information from various sources such as e-journals and e-databases. to be able to provide citation analysis or display citation statistics.
Reference manager applications are now not only to make quotations easier but also to support writers in obtaining valid, good, and scientifically accountable sources of information. Knowledge or skills to use reference managers are important in the context of citation management and avoiding plagiarism at this time. Academics, including librarians, must have the ability at least one of the above reference manager programs.
Sources:
1. Barret Library and Information Technology Services (n.d.). What is a Citation. Accessed from http://www.rhodes.edu/barret/5.1.6_citation.pdf
2. Coates Library, Trinity University. (n.d.). Turabian Stye Citations (Notes ΓÇÉ Bibliography). Accessed July 4, 2013, from http://lib.trinity.edu/research/citing/turabiannotes.pdf
3. Hunter, J. (n.d.) The Importance of Citation. Accessed from http://web.grinnell.edu/Dean/Tutorial/EUS/IC.pdf
4. Texas U&M University Library (n.d.) What is a Citation? Accessed from library.tamu.edu/help/helpΓÇÉyourself/usingΓÇÉmaterialsΓÇÉservices/onlineΓÇÉtutorials/ citing ΓÇÉ sources / index.html
For further information on what citations are and how to use the Reference Manager, please look at the PPT as follows:
-
Siswa harusTandai selesai
Hi there,
Kuntz is inviting you to a scheduled Makeup class Research Methodology
Time: Mon, November 7, 2022, 7:00 PM Asia/Jakarta(GMT+7:00)
Join from a PC, Mac, iPad, iPhone or Android device:
Please click this URL to start or join. https://csueb.zoom.us/j/84903591959
Or, go to https://us02web.zoom.us/join and enter meeting ID: 849 0359 1959
Join from a H.323/SIP room system:
IP Address: 162.255.37.11 (US West) or 162.255.36.11 (US East)
Meeting ID: 849 0359 1959
-
-
-
Siswa harusTandai selesai
1. Students are able to understand the concept of background
2. Students are able to develop the research design
3. Students are able to develop a background based on observation and investigation results
4. Students are able to identify problems and formulate research problems
Therefore:
Students are able to understand concepts and apply it
-
Siswa harusTandai selesai
The Urgency of Research Design
In conducting research, especially for quantitative research, one important step is making a research design. Research design is a strategy to achieve predetermined research objectives and acts as a guide or guide for researchers throughout the research process (Nursalam, 2003: 81).
The same thing was also stated by Sarwono. According to Sarwono (2006) research design is like a road map for researchers who guide and determine the direction of the research process properly and precisely in accordance with the objectives that have been set, without the correct design a researcher will not be able to carry out research properly because the person concerned does not have clear directional guidelines.
In other words, research design, research design, or research design is a framework or blueprint for conducting research. This blueprint details the procedures required to obtain the information needed in preparing or solving the problem being studied. That includes determining which research questions to answer, how and when data will be collected, and how the data will be analyzed.
The research design lays the foundation for conducting a research project. Good design ensures that the research project will be relevant to the problem and will use economical procedures.
Type of research design
The research design depends on the research approach used by the researcher, in terms of intermconsisting of:
1. Quantitative
Quantitative methods are used to test the relationship between variables with the main objective being to analyze and represent the relationship mathematically through statistical analysis. This is the type of research approach most commonly used in scientific research problems.
The scope of quantitative research design includes experimental, causal, correlational, and quasi-experimental designs.
2. Qualitative
Qualitative methods are chosen when the objective of the research problem is to examine, understand, and describe a phenomenon. This method is commonly used in social science research.
Qualitative methods are often used to study ideas, beliefs, human behavior, and other research questions that do not involve the relationship between variables. Research designs that are often used are case studies, historical studies, narrative, phenomenology, and grounded theory.
Type / Research Method
The research method or research design is part of the methodology. You can apply the methodology to various kinds of design research. There are several types of research designs that you can choose according to the research you want to do, including experimental, ethnographic, historical research, correlational, comparative, causal, survey, case study, and action research methods. In the field of information technology, research designs or research methods that are most widely applied are experimental research designs and case studies.
1. Experimental Research
Experimental research is research that allows it to be the cause of a determined behavior. In illustrating experimental research can be carried out in two groups, where the first group is called the control without being given any treatment, while the second group is given treatment which assumes the two groups are the same.
In this experimental design there is also a cause and effect relationship. This causal linkage occurs when the effect is the effect of correlation. The impact causes an effect and you can also seek an explanation of the causal relationship. For example, when looking at the causal linkages between learning systems that implement e-learning and learning systems that don't apply e-learning.
2. Correlational Research (Correlational)
Correlational research is research conducted to see the relationship between two variables. A correlation does not guarantee a causal or causal linkage, but causality does guarantee a correlation.
For example, the growth rate of startups in Jakarta with high smartphone users in Sukabumi. The higher the smartphone user, the higher the startup growth rate. See whether the correlation is meaningful or not. Correlation can be interpreted even though the geographical location is far away. You must be required to be critical when you see a significant correlation or not, otherwise, the correlation will fail or fail.
3. Causal Research - Comparative
Causal - comparative research, also called causal research, is one of the scientific thinking ideas in preparing a research methodology. Causal research can be classified into experimental research but can also be classified in other forms such as comparative. Independent variables in the comparative study cannot be manipulated nor can they be given treatment.
Comparative or comparative research is research that focuses more on the impact or effect that occurs by looking for what is the cause of these impacts and reviewing the differences between two or more groups and providing an explanation of the differences between these groups. For example, why are foreign startups more innovative and creative than domestic local startups.
4. Survey Research
Survey research is included in quantitative research in examining the behavior of the object of research. Survey research is research that uses a sample of a data population and uses a questionnaire as a data collection tool. Survey research requires a population of data in large enough or large numbers so that researchers can get results that reflect real conditions in the field.
For example, you want to know how the market share of website making services is. To answer this problem, it is necessary to have a flow of thought in formulating questions in order to answer the above problems. By using a specific line of questions, you will be able to find out what the respondent's opinion is without them knowing it.
5. Action Research
Action research is research that focuses on direct social action. This research was carried out by going directly to the research location because the research location could not be carried out by a survey. By studying and understanding and noting existing patterns.
Action research is applied to find ways of doing problems at the same time. This action research is a method that is based on community action which is often carried out in a broad research location or setting, such as in a factory, school, or government office.
6. Historical Research
Historical or historical research is the same as literature research. Historical research is done by reviewing literature and books and following the pattern of the literature or books being reviewed. For example, you want to know how the company's attitude towards internet development. In answering these problems from historical research, you need to summarize and look for historical patterns, especially at the beginning of the application of the internet. From here you have to review the changing era that is represented, especially how the internet has changed from era to era.
7.Case Studies Research
Case study research is research that focuses all attention on a particular case using various objects, be it individuals or groups as a case study material. Case study research is generally used to focus on exploring and collecting deeper data on the object of research being researched so that it can answer the problems that are happening. The research design is descriptive and exploratory in nature.
In the case of study research, there is an empirical investigation of the phenomenon the researcher wants to solve. Suppose what phenomena exist in the AI ΓÇïΓÇïfield. How and why people who use AI fail, some succeed. This phenomenon can be explored by conducting case study research. Case studies can be obtained from organizations, communities, companies, schools, or larger scope.
8. Ethnographic research
Ethnographic research is research that focuses on the self and culture of a group of people or society. Usually, this research design is applied to research about culture in general. Ethnographic research is similar to action research, it focuses on the organization that defines groups of people. For example, a study on the distribution of irrigation in Sukabumi. The people gather to distribute water to the fields.
-
Siswa harusTandai selesai
Overview
The background of the problem is information that is arranged systematically with regard to problematic phenomena and problems that are interesting to examine. Problems occur when ideal expectations about something are not the same as the reality that happens. Not all problems are phenomena and interesting. A phenomenal problem is when it becomes the attention of many people and is discussed in various circles in society.
The background is intended to explain the reasons why the problems in research want to be studied, the importance of the problems, and the approaches used to solve these problems both from a theoretical and practical perspective.
The research background contains:
Rational and essential reasons that make researchers interested in conducting research based on facts, data, references, and previous research findings. Symptoms of gaps in the field as a rationale for raising problems and how research fills existing gaps in relation to the topic under study. The complexity of the problem if the problem is ignored and will have an impact that is difficult, hindering, disturbing, and even threatening.
Approaches to addressing problems from a policy and theoretical perspective. A brief explanation of the position or position of the problem under study within the scope of the research field.
How to create a problem background with the following steps:
At the beginning of the background is an overview of the problem to be raised. With the inverted pyramid model, create an overview of problems ranging from global things to focus on the core problem, the object, and scope to be studied. In the middle section, reveal facts, phenomena, data, and expert opinion regarding the importance of the problem and its negative effects if not resolved immediately with the support of previous theories and research. The final section is filled with alternative solutions that can be offered (theoretical and practical) and finally, the title appears.
-
Siswa harusTandai selesai
-
Siswa harusTandai selesai
Please report the progress of the topic, and your table matrix literature (min 5 articles)
-
-
-
Siswa harusTandai selesai
1. Students are able to choose a topic and determine the observation unit and scientific research analysis unit
2. Students are able to identify problems
3. Students are able to formulate research problems
-
Siswa harusTandai selesai
The background of the problem is information that is arranged systematically with respect to problematic phenomena and problems that are interesting to examine. Problems occur when the ideal expectation for something is not the same as the reality that happens. Not all problems are phenomena and interesting. A phenomenal problem is when it becomes the attention of many people and is discussed in various circles in society.
The background is intended to explain the reasons why the problems in research want to be studied, the importance of the problems and the approaches used to solve these problems both from a theoretical and practical perspective.
The research background contains:
A rational and essential reason that makes researchers interested in conducting research based on facts, data, references and previous research findings. Symptoms of gaps in the field as a rationale for raising problems and how research fills existing gaps in relation to the topic under study. The complexity of the problem if the problem is left alone and will have an impact that is difficult, hindering, disturbing and even threatening.
Approaches to addressing problems from a policy and theoretical perspective. A brief explanation of the position or position of the problem under study within the scope of the research field.
How to create a problem background with the following steps:
At the beginning of the background is an overview of the problem to be raised. With the inverted pyramid model, create an overview of problems ranging from global things to focusing on the core problem, the object and scope to be studied. In the middle section, reveal facts, phenomena, data and expert opinions regarding the importance of the problem and its negative effects if they are not immediately resolved with the support of previous theories and research. The final section is filled with alternative solutions that can be offered (theoretical and practical) and finally the title appears.
-
Siswa harusTandai selesai
-
-
-
Siswa harusTandai selesai
1. Students are able to understand variables
2. Students are able to identify the types of research variables
3. Students are able to understand the types and positions of variables in research
-
Siswa harusTandai selesai
student ability to understand concepts and explain:
1. Understanding Research Variables
2. Types of research variables
3. Study of theory-based variables
-
Siswa harusTandai selesai
Research variables are anything in the form that is determined by a researcher for the purpose of studying so that information is obtained about it and a conclusion is drawn.
Variables are very important in a study because it is impossible for a researcher to conduct research without variables. Most experts define research variables as conditions that have been manipulated, controlled, or observed by a researcher in a study.
Some experts also define that what is called a variable is anything that will be the object of observation in a study. From the two definitions above, it can be interpreted that the research variables include the factors that play a role in the research process itself.
This research variable is very much determined by the theoretical basis and its clarity which is confirmed by the research hypothesis. Therefore, if the theoretical basis in a study is different, the results of the variables will be different.
Types of Research Variables
According to its nature, this variable can be divided into 5, namely: The nature of the variable, the relationship between the variables, the urgency of opening the instrument, and the type of measurement scale. Here's the explanation.
2.1. Variabels seen from Relations between variables
1. Independent Variable
This variable has an influence or causes changes in other variables. So it can be said that changes that occur in this variable are assumed to result in changes in other variables.
For example, if in a study it is stated that it will try to reveal the "influence of learning motivation on student achievement", the independent variable is "learning motivation". It is called an independent variable because this variable does not depend on other variables. Meanwhile, the variable "learning achievement" depends on and is influenced by the variable "learning motivation".
This independent or independent variable is also commonly referred to as the stimulus variable, influence and predictors. In structural equation capitalization, independent variables are called exogenous variables.
2. Dependent Variable
The dependent variable or dependent is a variable whose existence becomes a consequence due to the existence of the independent variable. It is called a related variable because the conditions or variations are related and influenced by variations in other variables.
In addition there are also other terms, namely the dependent variable, because the variation depends on the variation of other variables. Then there are those who mention the output variables, criteria, response, and indogeneity.
Examples of dependent variables: If a researcher wants to reveal "the effect of learning motivation on student achievement" then the dependent variable is "student achievement". This variable is called the dependent variable because high and low student achievement depends on the learning motivation variable.
3. Control Variable
This type of variable is a variable that is limited and whose influence is controlled so that it does not affect the symptoms being studied, in other words, the impact of the independent variable on the dependent variable is not influenced by external factors that are not studied.
In some studies, this variable is not stated explicitly, but rather in experimental research. This variable requires very important control.
This is done in such a way as to reduce the complexity of the problem being studied. Besides being used for experimental research, control variables are also often used by researchers when they want to do research that is comparative in nature.
For example, the effect of learning methods on student achievement. The independent variable in this variable is the teaching method, while the dependent variable is the student's learning achievement.
The variables that are set are the same, namely the same subjects, for example, chemistry lessons. With the determination of the control variable, the impact of the magnitude of the effect of teaching on student learning achievement can be known more with certainty.
2.2. Variables seen drom Judging from the nature
These variables are grouped into 2, namely:
1. Dynamic Variables
The definition of a dynamic variable is a variable that can be changed to increase its condition and characteristics. This variable allows manipulation or changes in accordance with the objectives desired by the researcher.
These changes can be either increase or decrease. For example, learning achievement, learning motivation, employee performance, and others
2. Static Variables
Static variables are variables that have fixed and immutable characteristics, both their existence and characteristics. Under normal conditions these properties are difficult to change.
Examples such as socioeconomic status, place of residence, gender, and others.
2.3. Variable seen from Factual Urgency
Based on whether or not an instrument is important in collecting data, it can be divided into 2, namely conceptual and factual variables, along with the explanation:
1. Conceptual Variables
They are called conceptual variables because these variables are not visible in fact and are hidden in a concept. Concept variables can only be known based on visible indicators.
Examples of concept variables are learning motivation, interests, self-concept, talents, performance, and others. Because it is hidden in the concept, the accuracy of the data contained in the concept variable depends on the accuracy of the indicators of several concepts that have been developed by the researcher.
2. Factual Variables
In contrast to the above, this variable is a variable that is in fact. Examples that you can see in this variable are genes, age, region / school of origin, religion, education, and so on.
Due to its factual nature, if there is an error in data collection it is not the instrument's fault but the respondent, for example the respondent is not honest or there are bad qualities in the respondent himself.
2.4. The variable is seen from the Tips for the Measuring Scale
There are about 4 levels in this variable, namely: Nominal, interval, and ratio, here is the explanation:
1. Nominal Variable
Nominal variables are variables that can only be grouped separately in categories and discrete. Nominal variables can also be called discrete variables. Judging from the name nominal or nomi has a name meaning, this indicates that the sign or label is only used to differentiate between variables.
Examples of this variable are: Gender, religion, region, and others. The nominal variable is also the variable that has the least variation.
2. Ordinal Variables
Ordinal variables are variables that have variations in differences, levels, sequences, but do not have the same difference in distance and cannot be compared. In this sequence, a gradation or a level is illustrated, but it cannot be known with certainty.
An example is the ranking in honesty, where the difference that describes the distance between the achievement of the score / achievement of the 1st, 2nd, 3rd place, and so on is not a problem.
3. Interval variable
In contrast to the above variables, this type of variable scale can be distinguished, stratified and has the same distance from the unit of measurement results, but the similarities are not comparable and not absolute. '
For example intervals, receiving report cards from learning outcomes are given numbers 4, 5, 6, 7, 8, 9, 10 and so on. The grading scale from numbers 1 - 10 has units of 1 per unit. The distance of numbers 4 to 5 is the same as the distance of 5 to 6…. etc.
However, this number has no meaning of comparison, in the sense that the number 4 obtained by a student does not mean that the student's intelligence is half better than the student who gets a point 8.
4. Variable Ratio
The ratio variable is a variable that has a score and can be differentiated, sorted, there is a similarity in the distance of difference, and can be compared.
For example, height, a person who is 50 cm tall is half of a person who is 100 cm tall.
2.5. Variable seen from the Measurement Time Appearance
In the measurement time, the variables can be grouped into 2, namely: Maximum and typical variables. Check it out below.
1. Variable Maximum
The maximal variable is the variable that during the data collection process, there is an incentive for the respondent to show maximum performance. For example, creativity, talent, achievement etc.
2. Typical Variables
Typical variables are those in which when the process of data collection processes there is no incentive for the respondent to show maximum performance, but rather to be honest with the measured variables.
Examples include: Interests, personality, attitudes towards certain subjects etc.
-
Siswa harusTandai selesai
Broadly speaking, the operational variable is how the researcher will explain a variable to be studied. There are various ways of examining something conceptual, so the operational definition of a variable must be distinguished from the conceptual definition. Researchers sometimes confuse conceptual definitions with operational definitions in the research methodology chapter.
Generally there will be many alternatives to measure a variable. When the researcher has chosen the method he will do, when formulated in a sentence it will become an operational definition. Each operational definition must be correct, because it only shows what the researcher meant in his research. So we must be careful if we want to copy operational definitions from other studies. Do not let us even have difficulty measuring a variable due to differences between our research conditions and the conditions of our imitation research.
If we look in the literature for the definition of a variable that we will examine, generally what we get is a conceptual definition. Something in the form of a construct of thought about something that is general in nature. In order to be able to make the operationalization of the correct conceptual definition of a variable, we must know or estimate what can be used to measure the variable.
In general, the steps for preparing a good operational definition are as follows:
First, determine what variables will be studied. Make sure the function of each variable, whether as an independent variable, dependent variable, or outside variable.
Find an appropriate conceptual definition for each of these variables. It can be from dictionaries, textbooks, or other people's research. You can also formulate your own based on experience or summaries from various literature. The point is that the conceptual definition focuses more on the concept of a variable.
Identify what can be done to measure these variables. There is always more than one way to measure something. Can by observing, comparing with other things, asking, or other methods.
Choose what method to actually describe a variable. Make sure it is specific with clear references. For example, whether to refer to a standardized questionnaire or a completely new method. It is necessary to detail how it will treat the data obtained. In general, there are 4 levels of measurement: 1) nominal, 2) ordinal, 3) interval and 4) ratio.
Write in narrative or tabular form. Generally, the thesis or thesis is in the form of a table, while the scientific publication manuscripts are generally in the form of a narrative.
Researchers are free to define research variables
Remember that the operational definition of a variable is a specific way of measuring that variable in a study. Different studies may measure a variable with the same conceptual definition differently. If you are going to research ways to help people quit smoking, then quitting smoking will be the dependent variable in your research. You can define quitting smoking as a person who has not smoked in 1 month, or as a person who has not smoked in a year, or perhaps only a 50% reduction in the number of cigarettes smoked in the past month.
Formulating operational definitions of all variables in a study is an important step in research design. Several other conceptual variables that have many operational definitions include: intelligence, fitness, health, diet, and quality of life. Several specific and standardized or frequently used questionnaires have been developed to measure these conceptual variables.
Be careful when copying from other research
In scientific articles, an explanation of the variable under study is usually found in the method section. Be sure to rate scientific articles well before deciding to replicate the operational definition. Do not let a reference to an article instead become a source of problems in writing your scientific paper.
Hopefully, this paper can help answer questions related to how to properly formulate an operational definition of research variables. thanks.
-
Siswa harusTandai selesai
Research design is a bridge for researchers to get a theoretical foundation as a guideline for sources of hypotheses, this bridge is actually a form of knowledge about research conducted by other researchers in the research area. This knowledge is not only in the form of an understanding of these researches, but also the interconnections that are formed between these studies.
As is known, a study does not just appear, but it always tries to solve or answer problems left by previous research. It is this relationship, which, if put together thoroughly, compiles a "map" of the writing of the Scientific Writing and is usually expressed in the form of
-
-
-
Siswa harusTandai selesai
1. Students are able to determine the relationship between variables
2. Students are able to compile research designs based on the nature of the research
-
-
Siswa harusTandai selesai
The research design refers to the overall strategy that you choose to integrate the different components of the study in a coherent and logical way, thereby, ensuring you will effectively address the research problem; it constitutes the blueprint for the collection, measurement, and analysis of data.
-
-
Siswa harusTandai selesai
To learn how the research mechanism in marketing, please study the PPT as follows:
-
Siswa harusTandai selesai
To learn how the research mechanism in HR, please study the PPT as follows:
-
-
-
Siswa harusTandai selesai
1. Students are able to formulate a frame of mind
2. Students are able to understand the meaning of the hypothesis
3. Students are able to formulate hypotheses
4. Students are able to determine who and in what population
5. Students are able to determine the number and method of sampling
6. Students are able to carry out business research
7. Students are able to test data quality
-
Siswa harusTandai selesai
Ability to understand concepts and explain them
-
Siswa harusTandai selesai
Research Hypotheses are temporary answers to research questions. Hypotheses can be explained from various points of view, for example etymologically, technically, statistically, and so on. Generally, the widely used notion is that a hypothesis is an answer while researching. Well, we will discuss more deeply and provide examples of these hypotheses.
-
Siswa harusTandai selesai
What is meant by Population and Sample? In simple terms, the population is the entire research subject, while the sample is part of the population. Let us discuss in this article in detail and clearly the population and sample and the differences between them. The difference in population and sample must be clearly understood so that it is not wrong when researchers conduct research. It is therefore important to understand the population and sample in the context of the Research Methodology.
The definition of population is:
What is the Population? The population is the total number of units or individuals whose characteristics are to be studied. And these units are called units of analysis and can be people, institutions, things, etc. (Djarwanto, 1994: 420).

What is a sample? Samples are also called examples. According to experts or experts, "the sample is a part of the population whose characteristics are to be studied" (Djarwanto, 1994: 43). A good sample, whose conclusions can be imposed on the population, is a sample that is representative or that can describe the characteristics of the population.Understanding Population and Sample According to Experts
16 Definition of Population According to Popular Experts
The following is an understanding of the population according to experts.
Definition of population according to experts:1. Netra, Nawawi and Arikunto:
-According to Netra (1976), population is all individuals who are general or general who have characteristics that tend to be the same.
-According to Hadari Nawawi (1983), Population is the whole object of research consisting of humans, animals, objects, growth, events, symptoms, or test scores as a source of data that has certain characteristics in a study conducted.
-According to Arikunto Suharsimi (1998: 117), population is the whole object of research. If someone wants to examine an element that is in the research area, then the research is a population study.2. Definition of population according to experts: Sugiyono, Bugin and Nursalam:
-According to Sugiyono (1997: 57), population is a generalization area consisting of objects / subjects that have certain quantities and characteristics that are determined by the researcher to be studied and then draw conclusions.
-According to Bugin (2000: 40), population is the whole (universe) of research objects in the form of humans, animals, plants, air, symptoms, values, events, life attitudes, and so on so that this object can be a source of research data.
-According to Nursalam (2003), population is the whole of the variables concerning the problem under study.3. Understanding Population According to Experts: Furchan, Margono, Nazir, Sabar and Zuriah:
-According to Furchan (2004), population is an object, all members of a group of people, organizations, or groups that have been clearly defined by the researcher.
-According to Margono (2004), population is all data that is the center of attention of a researcher within a predetermined scope and time. Population is related to data, if a human being provides data, then the size or number of the population will be as many humans.
-According to Nazir (2005), population is a group of individuals with qualities and characters that have been determined by the researcher. Traits, characteristics, and qualities are known as variables. He divides the population into two, namely finite and infinite populations.
-According to Sabar (2007), population is the entire object of research. If someone wants to research all the elements in the research area, then the research is a population study or population study or census study.
-According to Zuriah (2009: 116), population is all data that concerns researchers within a predetermined scope and time.4. Understanding Population According to Experts: Sudjana, Widyanto, Mulyatiningsih, Howell and Morissan:
-According to Sudjana (2010: 6), Population is the totality of all possible values, counting or measurement results, quantitative or qualitative regarding certain characteristics of all complete and clear group members who want to study their properties.
-According to Widiyanto (2010: 5), population is a group or collection of objects or objects that will be generalized from the research results.
-According to Mulyatiningsih (2011: 19), population is a group of people, animals, plants, or objects that have certain characteristics to be studied. The population will be the area for generalizing the conclusions of the research results.
-According to Howel (2011: 7), population is a collection and events where you are interested in these events.
-According to Morissan (2012: 19), population is a collection of subjects, variables, concepts, or phenomena. We can examine each member of the population to find out the nature of the population concerned.Thus above are some of the definitions of the population according to experts.
Definition of Samples
What is a sample according to the experts? The following is the understanding of the sample according to the experts:
3 Definition of Samples According to Experts
According to Sugiyono (2008: 118), the sample is a part of the whole as well as the characteristics of a population.
If the population is large, so the researchers certainly do not allow it to study the entirety of that population because of several obstacles that will be faced later such as limited funds, energy, and time. So in this case it is necessary to use samples taken from that population.
And then, what is learned from the sample will get the conclusion that will be applied to the population. Therefore, the sample obtained from the population must be truly representative (representing).
According to Arikunto (2006: 131), the sample is a part or representative of the population to be studied. If the research is carried out by part of the population, it can be said that the research is a sample study.
According to Nana Sudjana and Ibrahim (2004: 85), the sample is part of the population that can be reached and has the same characteristics as the population that the sample is taken from.
Thus above are some of the understanding of the sample according to the experts. After reading the explanation above, hopefully the readers have understood or at least have a picture of the meaning and differences of the population and sample.
Summary of Population and Sample Differences
Let's summarize the differences between the population and the sample based on an illustration as follows:

Based on the population illustration image and the sample above, we can conclude that the population is like an organism, while the sample is an organ. So, the sample is an inseparable part of the population. And the sample in this case must be able to represent the characteristics of the entire population. The hope is, if we do research on a sample, the results should be used as a generalization for the entire population. Sample Criteria There are two sample criteria, namely inclusion criteria and exclusion criteria. Determination of sample criteria is needed to reduce biased research results. Inclusion criteria are general characteristics of research subjects from an affordable target population to be studied (Nursalam, 2003: 96). Meanwhile, what is meant by exclusion criteria is eliminating or removing subjects who meet the inclusion criteria from the study for certain reasons (Nursalam, 2003: 97). The reasons that were considered in determining the exclusion criteria included: - The subject cancels his willingness to become research respondents, and - Subject was unable to attend or was not at the place when data collection was carried out. - Sampling technique - Definition of sampling technique - The sampling technique or sampling technique is a sampling technique from the population. The sample is part of the population. then examined and the results of the study (conclusions) are then applied to the population (generalization). The Benefits What are the benefits of sampling? The following are the benefits: -Save on research costs. -Save time for research. -Can produce more accurate data. -Expanding the scope of research. -Sampling technique requirements What are the requirements for the sampling technique? Let's explain: Sampling techniques may be used if the population is homogeneous or has the same or at least almost the same characteristics. And if the population condition is heterogeneous, the resulting sample may not be representative or cannot describe the characteristics of the population. Types of sampling techniques What are the different types of sampling techniques? Of course a lot. The following are among the types of sampling techniques: 1) Probability sampling technique Probability sampling technique or random sampling is a sampling technique that is carried out by providing opportunities or opportunities for all members of the population to become samples. Thus the sample obtained is expected to be a representative sample. This kind of sampling technique can be done in the following ways. a) Simple sampling technique. The most popular method used in the simple design of the sample drawing process is by drawing. b) A systematic sampling technique (systematic sampling). This procedure is in the form of sampling by taking each umpteenth case (serial number) from the population list. c) Sampling technique using the proportional symbol. If the population consists of subpopulations, the research sample is taken from each subpopulation. And as for the method of taking it can be done by lottery or systematically. d) The sampling technique is a stratified symbol. If the subpopulations are stratified, the sampling method is the same as in the proportional sampling technique. e) Cluster sampling technique (cluster sampling) And there are times when researchers do not know exactly the characteristics of the population that they want to be research subjects because the population is spread over a very large area. For this reason, researchers can only determine sample areas, in the form of cluster groups that are determined gradually. This kind of sampling technique is called cluster sampling or multi-stage sampling. 2) Nonprobability sampling technique. Nonprobability sampling technique is a sampling technique from a population that is found or determined by the researcher and/or according to expert judgment. And some types or ways of sampling from the population on a nonprobability basis are as follows: a) Purposive sampling or judgmental sampling Purposive sampling from the population is a method of sampling that is done by selecting subjects based on specific criteria set by the researcher. b) Snow-ball sampling (snowball sampling). Sampling from the population-based on this pattern is done by determining the first sample. The next sample is determined based on information from the first sample, the third sample is determined based on information from the second sample, and so on so that the sample size is getting bigger as if there was a snowball effect. c) Quota sampling (quota sampling). This sampling technique is carried out on the basis of a predetermined amount or quota. Usually the research samples are easy to find subjects, making the data collection process easier. d) Accidental sampling or convenience sampling research, In research, it is possible to obtain samples from populations that were not planned in advance. Rather, it is by chance, that the unit or subject is available to the researcher when data collection is carried out. And the process of obtaining such a sample is known as accidental sampling from the population. Determination of the Number of Samples If the population is considered too large, in order to save time, cost, and energy, the researcher does not examine all members of the population but will use a sample.
When the researcher intends to study only part of the population (sample), the question that always arises is how many samples meet the requirements. There is a statistical law in determining the number of samples, namely the greater the number of samples, the more it describes the state of the population (Sukardi, 2004: 55).
Determination of the number of samples based on population characteristics
And besides, based on the provisions above, it is also necessary to determine the number of samples studied from the characteristics of the population. If the population is homogeneous, a large sample is not required. For example, in checking blood type.
Although the use of large sample size is highly recommended, considering the various limitations of the researcher, the researcher tries to take a minimum sample with the statistical requirements and rules being met as recommended by Isaac and Michael (Sukardi, 2004: 55).
By using a certain formula (see Sukardi, 2004: 55-56), Isaac and Michael give the final result of the number of samples to the total population between 10 - 100,000.
-
Siswa harusTandai selesai
Definition of Data
Data is any information that has been collected, observed, generated or made to validate research findings that contain originality (Sekaran, 2016). Even data is the raw material that forms all research reports (Dempsey & Dempsey, 2002: 76). Based on the explanation of the experts above, in this article, the writer will mention the term data as research data.
Understanding data in a broad sense is a collection of information that can be amplified, processed, transmitted and analyzed. However, if we want to interpret data in a narrow sense in the context of research, then what is meant by data is research data. For the second meaning, it is better if we refer to the research definition data that has been put forward by the experts above.
Classification of Data
Research data can be classified based on the nature, source, and also the scale of measurement. Below we will explain one by one about the classification of research data:
Based on the nature:
1) Quantitative data: data in the form of numbers. For example, weight, house area, height, IQ score, etc.
2) Qualitative data: data in the form of words or statements. Can also be interpreted as categorical data, because it is usually in the form of categories or groupings based on certain names or initials. For example: Groups of Civil Servants, Farmers, Laborers, Entrepreneurs, etc.
Data Based on the source
Based on the source, the data are classified as follows:
1. Primary data
Primary data is data obtained directly by the party for which the data is required.
2. Secondary data
Secondary data is data that is not obtained directly from the party for which data is required.
Data Based on the Measurement Scale
Based on the measurement scale, the data are classified as follows:
Data which is the measurement result of research variables, has the type of measurement scale as contained in the research variables. Thus, based on this review, the data can be divided into:
1. Nominal Data
Nominal data is a type of qualitative data, in which there is a category in which there is no difference between higher and lower degrees. For example: The sex of women and men, where men are not necessarily higher than women, and vice versa.
2. Ordinal Data
Ordinal data is almost the same as nominal data, only there are differences in degrees higher and lower. For example: Education, where tertiary education is higher than SMA, and vice versa, SMA education is lower than tertiary education.
3. Interval data
Interval data is data that belongs to the quantitative data group, which is in the form of numbers in which mathematical operations can be performed and the order between one data and another has the same range. For example: Test scores, which are said to be sequential with the same range, namely after 1 then 2 then 3 and so on. And it is said that mathematical operations can be performed, for example: the number 1 can be multiplied by the number 2 and the result is 2.
Another important characteristic is that the interval data does not have the absolute 0 and 100 absolute at the same time or in another sense the percentage between one data and the whole data cannot be ascertained. means absolute 0, for example, the test score. In common sense, there cannot be a test score less than 0. Whereas 100 is absolute for example test scores, logically there cannot be an exam score of more than 100.So the interval data is for example body weight, where it cannot be ascertained how much the highest score actually is weight body. It could be that people weigh tens of kilos, hundreds or even thousands of kilos.
4. Ratio Data
Ratio data is data that is actually the same as iterval data, but the difference is that ratio data can be made a percentage because there are absolute 0 and 100 values. As discussed above, for example test scores that have a value limit of 0 to 100.If a student gets a score of 25, it can be interpreted that the score is 25% of the maximum value of 100.
-
Siswa harusTandai selesai
Langkah Dalam Teknik Pengambilan Sampel
Menurut Dalen (1981), beberapa langkah yang harus diperhatikan peneliti dalam menentukan sampel, yaitu:
1. Menentukan populasi,
2. Mencari data akurat unit populasi,
3. Memilih sampel yang representative,
4. Menentukan jumlah sampel yang memadai.
Jenis Teknik Penentuan Sampel
Untuk menentukan sampel dalam penelitian, terdapat berbagai teknik pengambilan sampel yang digunakan. Teknik sampling berdasarkan adanya randomisasi, yakni pengambilan subyek secara acak dari kumpulannya, dapat dikelompokkan menjadi 2 yaitu sampling nonprobabilitas dan sampling probabilitas. Teknik-teknik sampling tersebut dapat dilihat pada skema berikut.
Menurut Sugiyono (2001), untuk menentukan sampel yang akan digunakan dalam penelitian, terdapat berbagai teknik sampling yang digunakan. Secara skematis ditunjukkan pada diagram berikut ini:
Dari diagram di atas menjelaskan pada kita bahwasanya teknik penentuan sampel dapat dikelompokkan menjadi dua, yaitu: Teknik pengambilan sampel pertama adalah Probability Sampling dan kedua adalah Nonprobability Sampling.
Yang termasuk ke dalam kelompok probability sampling antara lain: simple random sampling, proportionate stratified random sampling, disproportionate stratified random sampling, dan area (cluster) sampling (disebut juga dengan sampling menurut daerah). Sedangkan yang termasuk ke dalam jenis nonprobability sampling antara lain: sampling sistematis, sampling kuota, sampling aksidental, purposive sampling, sampling jenuh, dan snowball sampling.
Berikut penjelasannya:
1. Probability Sampling
Probability sampling adalah salah satu teknik pengambilan sampel yang memberikan peluang yang sama bagi setiap unsur (anggota) populasi untuk dipilih menjadi anggota sampel. Dengan probability sampling, maka pengambilan sampel secara acak atau random dari populasi yang ada.
Teknik sampel probability sampling meliputi:
a. Simple Random Sampling
Simple Random Sampling dinyatakan simple (sederhana) karena pengambilan sampel anggota populasi dilakukan secara acak tanpa memperhatikan strata yang ada dalam populasi itu.
Simple random sampling adalah teknik untuk mendapatkan sampel yang langsung dilakukan pada unit sampling. Maka setiap unit sampling sebagai unsur populasi yang terpencil memperoleh peluang yang sama untuk menjadi sampel atau untuk mewakili populasinya. Cara tersebut dilakukan bila anggota populasi dianggap homogen.
Teknik tersebut dapat dipergunakan bila jumlah unit sampling dalam suatu populasi tidak terlalu besar. Cara pengambilan sampel dengan simple random sampling dapat dilakukan dengan metode undian, ordinal, maupun tabel bilangan random.
Untuk penentuan sample dengan cara ini cukup sederhana, tetapi dalam prakteknya akan menyita waktu. Apalagi jika jumlahnya besar, sampelnya besar.
b. Proportionate Stratified Random Sampling
Proportionate Stratified Random Sampling biasa digunakan pada populasi yang mempunyai susunan bertingkat atau berlapis-lapis. Teknik ini digunakan bila populasi mempunyai anggota/unsur yang tidak homogen dan berstrata secara proporsional. Kelemahan dari cara ini jika tidak ada investigasi mengenai daftar subjek maka tidak dapat membuat strata.
c. Disproportionate Stratified Random Sampling
Disproportionate Stratified Random Sampling digunakan untuk menentukan jumlah sampel bila populasinya berstrata tetapi kurang proporsional.
d. Cluster Sampling (Area Sampling)
Cluster Sampling (Area Sampling) juga cluster random sampling. Teknik pengambilan sampel ini digunakan bilamana populasi tidak terdiri dari individu-individu, melainkan terdiri dari kelompok-kelompok individu atau cluster. Teknik sampling daerah digunakan untuk menentukan sampel bila objek yang akan diteliti atau sumber data sangat luas.
Kelemahan teknik pengambilan sampel ini dapat dilihat dari tingkat error samplingnya. Jika lebih banyak di bandingkan dengan pengambilan sampel berdasarkan strata karena sangat sulit memperoleh cluster yang benar-benar sama tingkat heterogenitasnya dengan cluster yang lain di dalam populasi.
2. Nonprobability sampling
Nonprobability sampling adalah salah satu teknik pengambilan sampel yang tidak memberi peluang/kesempatan yang sama bagi setiap unsur atau anggota populasi untuk dipilih menjadi sampel. Jenis teknik sampling ini antara lain:
a. Sampling Sistematis atau Systematic Sampling
Sampling sistematis adalah teknik penentuan sampel berdasarkan urutan dari anggota populasi yang telah diberi nomor urut.
b. Sampling Kuota atau Quota Sampling
Sampling kuota adalah teknik untuk menentukan sampel dari populasi yang mempunyai ciri-ciri tertentu sampai jumlah (kuota) yang diinginkan. Teknik ini jumlah populasi tidak diperhitungkan akan tetapi diklasifikasikan dalam beberapa kelompok. Sampel diambil dengan memberikan jatah atau quorum tertentu terhadap kelompok. Pengumpulan data dilakukan langsung pada unit sampling. Setelah jatah terpenuhi, maka pengumpulan data dihentikan.
Teknik ini biasanya digunakan dan didesain untuk penelitian yang menginginkan sedikit sampel dimana setiap kasus dipelajari secara mendalam. Dan bahayanya, jika sampel terlalu sedikit, maka tidak akan dapat mewakili populasi.
c. Sampling Aksidental atau Accidental Sampling
Sampling aksidental adalah teknik penentuan sampel berdasarkan kebetulan, yaitu siapa saja yang secara kebetulan bertemu dengan peneliti dapat digunakan sebagai sampel, bila dipandang orang yang kebetulan ditemui itu sesuai sebagai sumber data.
Dalam teknik sampling aksidental, pengambilan sampel tidak ditetapkan lebih dahulu. Peneliti langsung saja mengumpulkan data dari unit sampling yang ditemui.
d. Sampling Purposive
Sampling purposive adalah teknik penentuan sampel dengan pertimbangan tertentu. Pemilihan sekelompok subjek dalam purposive sampling, didasarkan atas ciri-ciri tertentu yang dipandang mempunyai sangkut paut yang erat dengan ciri-ciri populasi yang sudah diketahui sebelumnya. Maka dengan kata lain, unit sampel yang dihubungi disesuaikan dengan kriteria-kriteria tertentu yang diterapkan berdasarkan tujuan penelitian atau permasalahan penelitian.
e. Sampling Jenuh
Sampling jenuh adalah teknik penentuan sampel bila semua anggota populasi digunakan sebagai sampel. Hal ini sering dilakukan bila jumlah populasinya relatif kecil, kurang dari 30 orang. Sampel jenuh disebut juga dengan istilah sensus, dimana semua anggota populasi dijadikan sampel.
f. Snowball Sampling
Snowball sampling adalah teknik pengambilan sampel yang awal mula jumlahnya kecil, kemudian sampel ini disuruh memilih teman-temannya untuk dijadikan sampel. Dan begitu seterusnya, sehingga jumlah sampel makin lama makin banyak. Ibaratkan sebuah bola salju yang menggelinding, makin lama semakin besar. Pada penelitian kualitatif banyak menggunakan sampel purposive dan snowball.
Pemilihan Jenis Teknik Penetapan Sampel
Pemilahan jenis teknik pengambilan sampel probabilitas dan nonprobabilitas didasarkan adanya randomisasi atau keacakan, yakni pengambilan subjek secara acak dari kumpulannya. Dalam hal randomisasi berlaku, setiap subjek penelitian memiliki kesempatan yang sama untuk dijadikan anggota sampel sejalan dengan anggapan bahwa pada dasarnya probabilitas distribusi kejadian ada pada seluruh bagian.
Tujuan Teknik Pengambilan Sampel menurut Sugiarto dalam Martono (2010:75)- Apabila kita tidak mungkin mengamati seluruh anggota populasi yang ada, hal tersebut dapat terjadi jika anggota populasi sangat banyak.
- Pengamatan terhadap seluruh anggota populasi dapat bersifat merusak.
- Menghemat biaya, waktu dan tenaga yang digunakan.
- Mampu memberikan suatu informasi yang akurat, lebih menyeluruh dan mendalam (komprehensif). (Martono, 2011:75).
-
-
-
Siswa harusTandai selesai
Kindly prepare your tasks as follows instruction:
1. Choose your interest Topics
2. Need to make your own Mapping Research using previous studies that relate to your own topic (on matrix literature studies)
You need submitted before 27th November, 2022
-
-
-
Siswa harusTandai selesai
1. Students are able to determine who and in what population
2. Students are able to determine the number and method of sampling
-
Siswa harusTandai selesai
In statistics and quantitative research methodology, a sample is a set of individuals or objects collected or selected from a statistical population by a defined procedure.[1] The elements of a sample are known as sample points, sampling units or observations.[citation needed] When conceived as a data set, a sample is often denoted by capital roman letters such and , with its elements expressed in lower-case (e.g., ) and the sample size denoted by the letter .[2][3]
Typically, the population is very large, making a census or a complete enumeration of all the individuals in the population either impractical or impossible. The sample usually represents a subset of manageable size. Samples are collected and statistics are calculated from the samples, so that one can make inferences or extrapolations from the sample to the population.
The sample may be drawn from a population without replacement (i.e. no element can be selected more than once in the same sample), in which case it is a subset of a population; or with replacement (i.e. an element may appear multiple times in the one sample), in which case it is a multisubset.[4]

A complete sample is a set of objects from a parent population that includes all such objects that satisfy a set of well-defined selection criteria.[5][failed verification] For example, a complete sample of Australian men taller than 2 m would consist of a list of every Australian male taller than 2 m. But it wouldn't include German males, or tall Australian females, or people shorter than 2 m. So to compile such a complete sample requires a complete list of the parent population, including data on height, gender, and nationality for each member of that parent population. In the case of human populations, such a complete list is unlikely to exist (the human population being in the billions). But such complete samples are often available in other disciplines, such as the set of players in a major sports league, the birth dates of the members of a parliament, or a complete magnitude-limited list of astronomical objects.
An unbiased (representative) sample is a set of objects chosen from a complete sample, using a selection process that does not depend on the properties of the objects.[6] For example, an unbiased sample of Australian men taller than 2 m might consist of a randomly sampled subset of 1% of Australian males taller than 2 m. But one chosen from the electoral register might not be unbiased since, for example, males aged under 18 will not be on the electoral register. In an astronomical context, an unbiased sample might consist of that fraction of a complete sample for which data are available, provided the data availability is not biased by individual source properties.
The best way to avoid a biased or unrepresentative sample is to select a random sample, also known as a probability sample. A random sample is defined as a sample where each individual member of the population has a known, non-zero chance of being selected as part of the sample.[7] Several types of random samples are simple random samples, systematic samples, stratified random samples, and cluster random samples.
A sample that is not random is called a non-random sample or a non-probability sampling.[8] Some examples of nonrandom samples are convenience samples, judgment samples, purposive samples, quota samples, snowball samples, and quadrature nodes in quasi-Monte Carlo methods.
REFERENCES
- Peck, Roxy; Olsen, Chris & Devore, Jay (2008), Introduction to Statistics and Data Analysis (3rd ed.), Belmont, Cal.: Thomson Brooks/Cole, p. 8, ISBN 978-0-495-11873-2, LCCN 2006933904, retrieved 2009-08-04
- ^ "List of Probability and Statistics Symbols". Math Vault. 2020-04-26. Retrieved 2020-08-21.
- ^ "What Is the Meaning of Sample Size?". Sciencing. Retrieved 2020-08-21.
- ^ Borzyszkowski, Andrzej M.; Sokołowski, Stefan, eds. (1993), "A characterization of Sturmian morphisms" (PDF), Mathematical Foundations of Computer Science 1993. 18th International Symposium, MFCS'93 Gdańsk, Poland, August 30–September 3, 1993 Proceedings, Lecture Notes in Computer Science, 711, pp. 281–290, CiteSeerX 10.1.1.361.7021, doi:10.1007/3-540-57182-5_20, ISBN 978-3-540-57182-7, Zbl 0925.11026
- ^ Pratt, J. W., Raiffa, H., and Schaifer, R. (1995). Introduction to Statistical Decision Theory. Cambridge, Mass.: MIT Press. ISBN 9780262161442. MR1326829
- ^ Lomax, R. G. and Hahs-Vaughan, Debbie L. An introduction to statistical concepts (3rd ed).
- ^ Cochran, William G. (1977). Sampling techniques (Third ed.). Wiley. ISBN 978-0-471-16240-7.
- ^ Johan Strydom (2005). Introduction to Marketing (Third ed.). Wiley. ISBN 978-0-471-16240-7.
-
-
Siswa harusTandai selesai
See the subject from PPT as follows
https://drive.google.com/file/d/1iAoXxDyc_vpdBOvquLN0GQ2PXfpIdK4I/view?usp=sharing
-
Siswa harusTandai selesai
Analisis bibliometric merupakan sebuah metode kuantitatif untuk menganalisis data bibliografi yang ada di artikel/jurnal. Analisis ini biasanya digunakan untuk menyelidiki referensi artikel ilmiah yang dikutip dalam sebuah jurnal, pemetaan bidang ilmiah sebuah jurnal, dan untuk mengelompokkan artikel ilmiah yang sesuai dengan suatu bidang penelitian.
Metode ini bisa digunakan di bidang sosiologi, humanities, komunikasi, marketing, dan rumpun sosial lain. Pendekatan yang digunakan dalam analisis bibliometric adalah pendekatan citation analysis (analisis kutipan) untuk melihat 1 artikel yang dikutip oleh 1 artikel lain, dan pendekatan co-citation analysis untuk menemukan 2 artikel atau lebih yang dikutip oleh 1 artikel.
Dapat disimpulkan bahwa Bibliometrik merupakan ilmu yang mengkaji tentang kepenulisan dengan menggunakan analisis matematis dan statistik. Dengan adanya ilmu ini kita akan mengetahui hal-hal tentang kepenulisan, salah satunya ada produktivitas pengarang. Seorang pengarang dapat dinilai produktif atau tidaknya dengan melihat jumlah karya yang ia tulis dalam kurun waktu tertentu, baik itu hasil karya sendiri tanpa membutuhkan penulis lain, ataupun hasil dari kolaborasi antar penulis.
Manfaat Analisis BibliometrikMenurut Ishak (2005), beberapa manfaat bibliometrik dalam perpustakaan adalah sebagai berikut:
1. Mengetahui majalah inti dalam berbagai disiplin ilmu
2. Mengetahui arah dan trend ilmu pengetahuan pada berbagai disiplin ilmu
3. Memperkirakan lengkap atau tidaknya literatur sekunder
4. Mengetahui subjek-subjek atau bidang-bidang dari disiplin ilmu
5. Mengetahui kepengarangan
6. Meramalkan arah perkembangan ilmu pengetahuan masa lalu dan masa mendatang
7. Mengatur arus masuk informasi dan komunikasi
8. Mengkaji keusangan dan penyebaran literatur ilmiah
9. Meramalkan produktivitas penerbit pengarang, organisasi, negara atau seluruh disiplin ilmu.
Jenis-Jenis analisis bibliometrik
Berikut beberapa ukuran bibliometrik yang umum:
ΓÇó Jumlah kutipan: berapa kali keluaran penelitian muncul dalam daftar referensi dokumen lain (artikel, buku, review, prosiding konferensi, dll). Ditemukan di: Google Scholar, Scopus, dan Web of Science.
ΓÇó Indeks-H: dirancang untuk mengukur produktivitas dan dampak penulis. Ini adalah jumlah terbitan pengarang (h) yang memiliki h atau lebih kutipannya. Ditemukan di: Google Scholar, Scopus, dan Web of Science.
ΓÇó Dampak kutipan berbobot bidang: rasio kutipan yang diterima relatif terhadap rata-rata dunia yang diharapkan untuk bidang subjek, jenis publikasi dan tahun publikasi. Ini dapat diterapkan pada keluaran penelitian atau kelompok keluaran penelitian. Ditemukan di SciVal.
ΓÇó Keluaran dalam persentil teratas: jumlah atau persentase keluaran penelitian dalam publikasi yang paling banyak dikutip di dunia, Inggris, atau negara tertentu. Ditemukan di Scopus dan SciVal.
ΓÇó Faktor Dampak Jurnal: berdasarkan jumlah rata-rata kutipan yang diterima per makalah yang diterbitkan dalam jurnal tersebut dalam dua tahun sebelumnya. Ditemukan di Journal Citation Reports.
ΓÇó CiteScore: jumlah rata-rata kutipan yang diterima dalam satu tahun kalender menurut semua item yang diterbitkan dalam jurnal tersebut selama tiga tahun berikutnya. Ditemukan di Scopus
ΓÇó Peringkat Jurnal SCImago: memberi nilai lebih tinggi pada kutipan dari jurnal yang lebih bergengsi. Ditemukan di Scopus
ΓÇó Scopus SNIP: rasio jumlah kutipan jurnal per makalah dan potensi kutipan di bidang subjeknya. Scopus SNIP menormalkan perbedaan subjek tingkat kutipan. Ditemukan di Scopus.
(Diadaptasi dari Metrics Toolkit berlisensi di bawah lisensi CC-BY 4.0.)
Sofware Bibliometrik
Beberapa penggunaan software dalam melakukan analisis bibliometrik antara lain:
1. Vosviewer
2. HistCit,
3. BibExcel,
4. Pajek,
5. Sci2,
6. Cytoscape
7. Gephy
Beberapa Software yang terkait dengan Bibliometrik, yaitu:
1. Scopus (scopus.com)
Sebenarnya ini bukan software, tapi lebih ke semacam sistem informasi. Atau lebih tepat lagi disebut sebagai pengindeks.
Scopus, dengan mekanisme tertentu mengindeks berbagai jurnal. Tentunya menggunakan metode dan ada syaratnya. Hasil indeks diolah, kemudian setelah matang, laludimakansajikan. Data Scopus ini tidak gratis, namun harus ditebus dengan uang dollar. Informasinya memuat performance jurnal, artikel, negara, peneliti. Termasuk info jejaring dan lainnya.ScimagoJR (scimagojr.com)
Journal Rank (JR), alias peringkat jurnal. Ya, Scimago ini mengambil data di Scopus, kemudian diolah lagi. Angka hasil olahan digunakan untuk memeringkatkan jurnal. Di Scimago dikenal istilah Q alias Quartile. Ada Q1,2,3,4. Artinya pemeringkatan jurnal dibagi 4. Seperempat terendah, seperempat di atasnya, seperempat di atasnya lagi, dan seperempat paling atas.
PoP (https://harzing.com/resources/publish-or-perish)
Publish or Perish (PoP). Istilah ini sudah dikenal luas: terbit atau mati. Namun PoP ini juga nama sebuah software. PoP bisa mengambil data dari Google Scholar (google cendikia) dan menampilkan serta menyimpannya.Sumber: (Diadaptasi dari Metrics Toolkit berlisensi di bawah lisensi CC-BY 4.0.)
Panduan Penggunaan Vosviewer Dalam melakukan analisis Bibliometrik (Systematic Literature) , bisa anda lihat pada file Pdf dan video pada link sbb:
-
-
-
Siswa harusTandai selesai
The development of social femininity in this world has made many people study more deeply about the things that happen in life. Many people give their interpretations of this social phenomenon, based on their knowledge and beliefs of that person. For example, lay people who say that the phenomenon occurs because it has something to do with mysticism, then the scholars say an event is a destiny or decree from the Creator and there are many more people who say these events are in various assumption.
Seeing this, as students we must be able to think rationally, logically and empirically, but also must be integrated based on a belief so that we can see this social phenomenon from various directions. And we can position ourselves if we mingle in society so that there will be no debate.
Therefore, as students we need scientific principles to answer this social phenomenon, with various scientific methods and a collection of both quantitative and qualitative data in order to support a fact of events that occur in social life in society.
Data collection is carried out to obtain the information needed in order to achieve the research objectives. The objectives expressed in the form of a hypothesis are temporary answers to the research questions. This answer still needs to be tested empirically, and it is for this purpose that data collection is required. The data collected is determined by the variables in the hypothesis. The data was collected by a predetermined sample. The sample consists of a set of analysis units as research targets.
In simple terms, data collection is defined as a process or activity carried out by researchers to uncover or capture various phenomena, information or conditions of the research location in accordance with the scope of the research.
Definition
Research instruments are tools selected and used by researchers in collecting activities so that these activities become systematic and made easier by them. Data collection instruments are methods that researchers can use to collect data. Instruments as a tool in using data collection methods are means that can be realized in objects, for example questionnaires, test kits, interview guidelines, observation guidelines, scales and so on.
According to Suharmi Arikunto (2006: 149) there are several instruments whose names are the same as the methods, including:
1) The instrument for the test method is a test or test questions
2) Instrument for the questionnaire method or questionnaire is a questionnaire
3) The instrument for the observation method is a check-list
4) The instrument for the observation method is an observation guide or it can also be a check-list
Therefore it can be concluded that the notion of data collection and research instruments is a process carried out to reveal various phenomena that occur in society by using various ways and methods so that this process runs systematically and its validity can be more accountable.
QUANTITATIVE RESEARCH DATA COLLECTION ENGINEERING
Collecting quantitative research data is data collection whose data is statistical figures that can be quantified. The data is in the form of variables and its operation is done with a certain scale such as nominal, ordinal, interval and ratio scales.
Data collection can be done in various places and in various sources and in various ways. When viewed from the place, it can be collected in the laboratory with experimental methods, at home with various respondents, and others. When viewed from the data source, data collection can use primary and secondary sources. Primary sources are data sources that directly provide data to data collectors, and secondary sources are sources that do not directly provide data to data collectors, for example through other people or through documents.
And the techniques used in collecting quantitative data are as follows:
1. Interview (Interview)
Interviews are used as a data collection technique if the researcher wants to conduct a preliminary study to find problems that must be researched, and also if the researcher wants to know things from the respondents that are more in-depth and the number of respondents is small / small.
The things that need to be held by researchers in using interview techniques and also questionnaires are as follows:
1. the subject (respondent) is the person who knows best about himself
2. what the subject states to the researcher is true and can be trusted
3. the subject's interpretation of the questions the researcher poses to him is the same as what the researcher intended.
Interviews can be conducted in a structured or unstructured manner, and can be conducted face-to-face or by telephone.
1. Structured interview
Structured interviews are used as a data collection technique, when the researcher or data collector knows exactly what information will be obtained. Therefore, in conducting interviews, data collectors have prepared a research instrument in the form of written questions whose alternative answers have also been prepared. With this structured interview each respondent was asked the same questions, and the data collector recorded them.
In conducting interviews, in addition to having to carry instruments as a guide for interviews, data collectors can also use tools such as tape recorders, pictures, brochures and other materials that can help carry out the interview smoothly. The following are examples of structured interviews about community responses to government services:
1) How is your response to education services in this district?
a) Very good
b) Good
c) Not good
d) Not very good
2) How is your response to health services in this district?
a) Very good
b) Good
c) Not good
d) Not very good
2. Unstructured interview
Unstructured interviews are independent interviews where the researcher does not use interview guidelines that have been structured systematically and completely for data collection. The interview guide used is only an outline of the problems to be asked. The examples are as follows: "What is your opinion on the current government policy regarding sugar imports? And how is the impact on traders and farmers".
Unstructured interviews are often used in preliminary research instead for more in-depth research on respondents. In preliminary research, the researcher tries to get initial information about the various issues or problems that exist on the object, so that the researcher can determine exactly what problems or variables should be studied.
In unstructured interviews, researchers do not know exactly what data will be obtained, so researchers listen more to what the respondents are saying. Based on the analysis of each of the respondents' answers, the researcher can ask the next questions that are more focused on one goal.
In conducting interviews, the interviewer must pay attention to the situation and conditions so that they can choose the right time when and where to conduct the interview.
2. Questionnaires
The questionnaire is a data collection technique used by giving a set of questions or written statements to the respondent to answer. The questionnaire is an efficient data collection technique if the researcher knows exactly what variables to measure and what can be expected from the respondent.
According to Uma Sekaran (2014) in expressing some of the principles of writing a questionnaire, they are as follows:
1. The principle of writing a questionnaire
1) The content and purpose of the question, what is meant here is that the content of the question is a form of measurement or not. If it is in the form of measurement, then making questions must be careful, each question must have a measurement scale and the number of items is sufficient to measure the variables under study.
2) The language used, the language used in the writing of the questionnaire must be adjusted to the respondent's language skills.
3) Types and forms of questions, the types of questions in the questionnaire can be open or closed, (in structured and unstructured interviews), and the form can use positive and negative sentences.
4) The questions are not ambiguous
5) Not asking who has forgotten
6) The question does not lead, meaning that the question does not lead to only good or bad answers.
7) The length of the questions, the questions in the questionnaire should not be too long, so that it will make respondents saturated in filling out.
8) The sequence of questions, the sequence of questions in the questionnaire, starts from general to specific things, or from easy to difficult things
3. Observation
According to (Arikunto, 2006: 229) in http://www.slideshare.net/NastitiChristianto/teknik-analysis-data-kuantitative-dan-kualitative using observation, the most effective way is to equip it with a format or blank observation as an instrument of consideration then the format arranged contains items about the events or behavior described. From experienced researchers, a clue is obtained that recording observational data is not just taking notes, but also making considerations then making an assessment on a graded scale. For example, paying attention to the reaction of television viewers, not only noting the reaction, but also assessing whether the reaction is very lacking, or not in accordance with what was desired.
QUALITIATIVE DATA COLLECTION ENGINEERING
Qualitative data collection technique is data collection whose data is descriptive in nature, meaning data in the form of categorized symptoms or in other forms such as photos, documents, artifacts, and field notes when the research was carried out.
In qualitative research methods, data is usually collected using several qualitative data collection techniques, namely; interviews, observation, documentation, and focused discussion (Focus Group Discussion). In this approach, the researcher creates a complex picture, examines words, reports in detail from the viewpoint of the respondent, and conducts studies on natural situations (Creswell, 1998: 15). Before each of these techniques is described in detail, it needs to be emphasized here that it is very important that every researcher must understand the reasons why each technique is used, to obtain what information, and which part of the focus of the problem requires interviewing techniques. which one requires the observation technique, which one has to do both. The choice of technique really depends on the type of information obtained.
Data Collection Techniques in Qualitative Research
1. Interview
Interviewing is a process of communication or interaction to collect information by means of question and answer between researchers and informants or research subjects. With advances in information technology like today, interviews can be carried out without face to face, namely through telecommunications media. In essence, an interview is an activity to obtain in-depth information about an issue or theme raised in research. Or, it is a process of proving information or information that has been obtained through other techniques previously.
There are some suggestions that before choosing interview as the method of data collection, the researcher must determine whether the research question can be answered appropriately by the person chosen as the participant. Hypothesis studies should be used to describe a process the researcher uses to facilitate interviews.
Several stages that must be considered in conducting interviews, namely:
a) The setting, the researcher needs to know the actual conditions of the research field to assist in planning data collection. Things that need to be known to support the implementation of data collection include the place for data collection, the time and duration of the interview, and the costs required.
b) The actors, get data on the characteristics of potential participants. This includes the situation that the participant prefers, opening sentences, introductory talks and the attitude of the researcher in approaching.
c) The events, compile the interview protocol, including:
1. Introduction,
2) Opening question,
3) Key questions, and
4) Probing, in this section the researcher will use the results in the second part to make introductory sentences and opening statements, as well as the results of the preparation of interview guidelines as key questions.
d) The process, based on the preparations in the first to third sections, then formulated an overall data collection strategy. This strategy includes all data retrieval planning starting from conditions, strategic approaches and how data collection is carried out.
5) Prioritizing process over results
6) Using non probability sampling.
The differences in quantitative and qualitative research techniques are (Suharsimi, 2006: 13):
NO
QUANTITATIVE
QUALITATIVE
1
Clarity of the elements of the objective of the approach, subject, and details from the start
The clarity of elements, subjects, samples, data sources is inconsistent, flexible, they develop as they go along
2
The research step, everything is planned until the preparation is prepared
The new research steps are identified firmly and clearly after the research is completed
3
Can use the sample and the results of the research applied to the population
Cannot use a population and sample approach
4
Hypothesis (if necessary):
a) Proposing a hypothesis that will be tested in the study
b) The hypothesis determines the predicted results
Hypothesis:
Does not use the previous hypothesis but can be born during the study
5
Design: in the design it is clear the research steps and the expected results
Design: the research design is flexible with steps and results that cannot be ascertained in advance
6
Data collection: activities in data collection allow for representation
Data collection: data collection activities should always be done by the researcher himself
7
Data analysis: performed after all data were collected
Data analysis: carried out simultaneously with data collection
CONCLUSION
Collecting data and research instruments is a process and method, tool or way to obtain information about what is being studied. And the techniques used in research can be in the form of quantitative and qualitative research data collection techniques, both of which have many advantages and disadvantages. One of the drawbacks of quantitative research data collection techniques is the difficulty in controlling other variables that can affect the research process either directly or indirectly. Meanwhile, qualitative research data collection techniques have drawbacks, namely that they take a long time, their reliability is questionable, the procedure is not standardized, is not structured and cannot be used for large-scale research.
-
Siswa harusTandai selesai
Observation or observation is an activity towards a process or object with the intention of feeling and then understanding knowledge of a phenomenon based on previously known knowledge and ideas, to obtain the information needed to continue a research.
-
Siswa harusTandai selesai
The operational definition of research variables according to Sugiyono (2015, p. 38) is an attribute or nature or value of an object or activity that has certain variations that have been determined by the researcher to be studied and then draw conclusions.
Variable operationalization is needed to determine the types and indicators of the variables involved in this study. In addition, the operationalization of the variables aims to determine the measurement scale of each variable, so that hypothesis testing using tools can be carried out appropriately. In more detail the operationalization of the variables in this research can be seen in the following table example:


-
Siswa harusTandai selesai
-
-
-
Siswa harusTandai selesai
In this topic, we will explain the scale of data measurement using a questionnaire from techniques, types to examples.
A questionnaire is an information gathering technique that enables the analyst to study the attitudes, beliefs, behaviors, and characteristics of key people in an organization who may be affected by a proposed system or by an existing system. By using a questionnaire, the analyst attempts to measure what is found in the interviews, in addition to determining how broad or limited the sentiments expressed in an interview are.
The use of the questionnaire is appropriate when:
1. Respondents (people who respond or answer questions) are far from each other.
2. Involve a number of people in the system project, and it is useful to know what proportion of a certain group agrees or disapproves of a particular feature of the proposed system.
3. Conducting studies to find out something and want to seek all opinions before the system project is given certain instructions.
4. Want to be sure that problems in the existing system can be identified and discussed in follow-up interviews.
TYPES OF QUESTIONS IN THE QUESTIONNAIRE
The difference between the questions in the interview and the questions in the questionnaire is that in the interview, there is an interaction between the questions and their meaning. In interviewing the analyst has the opportunity to filter a question, define terms that are not clear, change the flow of questions, respond to complex views and generally control to fit the context. Some of the above opportunities are also possible in the questionnaire. So for the analyzer the questions must be absolutely clear, the flow of questions makes sense, the questions from the respondents are anticipated and the order of the questions is planned in detail.
The types of questions in the questionnaire, as follows:
1. Open Questions
Questions that provide respondents with open response options. In an open-ended question, anticipate the type of response that will arise. The response received must still be able to translate correctly.
2. Closed Questions
Questions that limit or close the response options available to the respondent.
The guidelines to follow when selecting the language for the questionnaire are as follows:
* Use the respondent's language whenever possible. Try to keep the words simple.
* Working with more specifics is better than being vague in the choice of words. Avoid using specific questions.
* Questions should be short.
* Don't side with the respondent by speaking to them in their lower level language choices.
* Avoid bias in the choice of words. Also avoid bias in difficult questions.
* Ask questions to the right respondents (meaning people who are able to respond). Don't assume they know much.
* Make sure that the questions are technically accurate enough before using them.
* Use software to check if the reading level is correct for the respondent
SCALE IN THE QUESTIONNAIRE
Scaling is the process of assigning numbers or symbols to an attribute or characteristic that aims to measure that attribute or characteristic. The reasons the systems analyst designs the scale are as follows:
1. To measure the attitudes or characteristics of the people who answered the questionnaire.
2. In order for respondents to choose the subject of the questionnaire.
DESIGNING QUESTIONNAIRE
Designing forms for data input is very important, as well as designing a questionnaire format is also very important in order to collect information about attitudes, beliefs, behaviors and characteristics.
The best questionnaire format is:
* Give sufficient free space,
* Points to empty space around page or screen text. To increase the response rate use white or slightly darker colored paper, for web survey designs use an easy-to-follow view, and if the form continues on several other screens it is easy to scroll to other parts.
* Give enough room for response,
* Ask respondents to mark answers more clearly.
* Using objectives to help determine format.
* Consistent with style.
2. Order of Questions
In answering the questions, it is necessary to think about the purpose of using the questionnaire and determine the function of each question in helping to achieve the goal.
* Questions regarding the importance for the respondent to continue, the questions must be related to the subject that the respondent considers important.
* Cluster items of the same content.
* Using the tendencies of association of respondents.
* Put forward less controversial items first.
CONTENTS OF THE QUESTIONNAIRE
The questionnaire must have a center of attention, namely the problem to be solved. Each question must be part of the hypothesis to be tested. In obtaining information that revolves around the problem to be solved, in general the contents of the questionnaire can be in the form of:
a. questions about facts
b. opinion question,
c. questions about self-perception.
HOW TO SAY A QUESTION
Although it is difficult to determine a general rule for how to ask questions, some important pointers regarding the above are worth knowing, including:
a. don't use difficult words
b. Don't use questions that are too general
c. avoid ambiguous questions (ambiguous),
d. do not use vague words,
e. Avoid suggestive questions
f. avoid presumptive questions
g. do not create questions that do respondents,
h. avoid questions that require memory,
i. use easy language (words and sentences should be simple)
j. use terms that are familiar to the respondent,
k. questions arranged systematically (simple to complex)
To support this question, there are several things that need to be considered, including:
a. State the request prioritizing the need for an answer from the respondent and the importance of the respondent in answering the problem. In this case :
* State who conducted the research (name & agency)
* State why the study should be carried out (objectives)
* State that without the participation of the respondent, the research could not be carried out.
b. Explain how to fill out the questionnaire as clearly as possible.
-
Siswa harusTandai selesai
The measurement scale is a measuring tool used to quantify the information provided by consumers if they are required to answer questions that have been formulated in a questionnaire. There are four measurement scales, namely nominal, ordinal, interval, and ratio scales.
Nominal Scale
Nominal scales are used to classify objects, individuals or groups. For example, classifying gender, religion, occupation or location. In carrying out this classification, numbers are used as symbols or labels. In our example, classifying gender, the number 1 is generally used for male and 2 for female. We cannot perform arithmetic operations with these numbers because they only indicate the presence or absence of certain characteristics. Another example that can be used in applications regarding marketing research, as follows:
Do you agree with marketing imported rice in the free market at this time?
Answer: a agree b. don't agree
Answers that agree are given a value of 1 and answers that do not agree are given a value of 0 or 2
Ordinal Scale
The ordinal measurement scale provides information regarding the relative number of different characteristics possessed by a particular object or individual. This level of measurement has nominal scale information coupled with certain relative rating tools which provide information on whether an object has more or less characteristics but not to find out how many advantages and disadvantages there are.
Example :
Answers to questions in the form of ratings, for example strongly disagree, disagree, agree, and strongly agree can be given the numbers 1, 2, 3, 4, and 5. These numbers are only ratings symbols and do not express amounts. Usually the answers to the questionnaire use a Likert scale that is used to measure attitudes, for example to agree or disagree with a statement or question.
Examples of applications in marketing research:
What do you think about airline X's ticket sales service?
Answer: a. very slow b. slow c. fast d. very fast
Very slow answers are given a value of 1 and so on.
An example of an ordinal scale is as follows:
1. Education level:
- Kindergarten (TK) = 1
- Elementary School (SD) = 2
- Junior High School (SMP) = 3
- High School (SMA) = 4
- Diplomas = 5
- Undergraduate = 6
2. Female beauty level:
- So pretty = 4
- Beautiful = 3
- Pretty Pretty = 2
- Less Beautiful = 1
Ratio Scale
Instrumen penelitian yang menggunakan skala likert dapat dibuat dalam bentuk checklist ataupun pilihan ganda. Contoh item pertanyaan dan pembobotan dalam skala Likert dengan bentuk checklist adalah sebagai berikut:

Research instruments that use a Likert scale can be made in the form of a checklist or multiple choice. Examples of question items and weighting on a Likert scale with a checklist are as follows:

Description of Weighting:
SS (Strongly Agree) = score 5
ST (Agree) = score 4
RG (Undecided) = score 3
TS (Disagree) = score 2
STS (Strongly Disagree) = score 1
b. Guttman Scale
The Guttman scale is a cumulative scale which is also known as a scalogram scale which is very good for convincing researchers about the unity of dimensions and attitudes or traits being studied, which are often called universal attributes. A measurement scale with this type will get a firm answer, namely "yes or no", "true or wrong", "ever or never", "positive or negative", "agree or disagree", and others.
The data obtained can be in the form of interval data or dichotomous ratios (two alternatives). So if on the Likert scale there are 3,4,5,6,7 intervals, from the words "strongly agree" to "strongly disagree", then on the Guttman scale there are only two intervals, namely "agree" and "disagree". Research using the Guttman scale is carried out if you want to get a firm answer to a problem that is asked.
The Guttman scale can be made not only in the form of multiple choices, but also in the form of a checklist. Answers can be made with the highest score of one and the lowest of zero. For example, agreeing answers are given a score of 1 and disagreeing is given a score of 0. Examples of instruments that use the Guttman scale can be seen in the table below:

c. Semantic Defferential Scale
The Differential Semantic Scale is developed by Osgood. This scale is also used to measure attitude, only the form is not multiple choice or checklist, but is arranged in a continuum line where the answer "very positive" is located on the right side of the line, and the answer that is "very negative" is located on the left side of the line, or vice versa. The data obtained is interval data, and usually this scale is used to measure certain attitudes/characteristics possessed by a person.
This scale is different from the Likert scale which uses a checklist or multiple choice, on this scale the respondent is directly given a choice of the weight of the thing in question from positive to negative. Respondents can provide answers by ticking or giving levels of answers. Respondents' answers lie in the range of positive to negative answers. This depends on the respondent's perception of the one being assessed. The image below is an example of an instrument that uses the Differential Semantic scale.

d. Rating Scale
Rating scale model scale, respondents will not answer one of the provided qualitative answers, but answer one of the available quantitative answers. Thus the rating scale is more flexible, flexible and not limited to measuring attitudes, but to measuring respondents' perceptions or judgments of another phenomenon. Such as a scale to measure socio-economic status, institutions, knowledge, abilities, process activities and others.
With a rating scale, the raw data obtained is in the form of numbers, then interpreted in a qualitative sense. Respondents' answers were happy or unhappy, agreed or disagreed, ever or never. What is important for constructors of instruments with rating scales is that they must be able to interpret each number given to the alternative answers for each instrument item. Certain people choose the answer number 2, but the number 2 by certain people is not necessarily the same as other people who also choose the answer with number 2. An example of an instrument using a rating scale can be seen in the image below.

-
-
-
Siswa harusTandai selesai
1. Students are able to analyze data
2. Students are able to interpret the results of data processing
-
Siswa harusTandai selesai
In research, the data analysis section may consist of a number of components. However, the overall data analysis process involves interpreting data in the form of text or images. For this reason, a researcher needs to prepare the data for analysis, carry out different analyzes, deepen understanding of the data, present the data, and make a broader interpretation of the meaning of the data. The following is a description of some of the general processes researchers could explain in their research to illustrate the overall data analysis activity.
Analysis
Data analysis is the process of systematically compiling data obtained from observation through organizing data into categories, describing them into units, conducting hypotheses to making conclusions that can be understood by observers themselves and others.
The data analysis process according to Sugiyono (2011) is as follows:
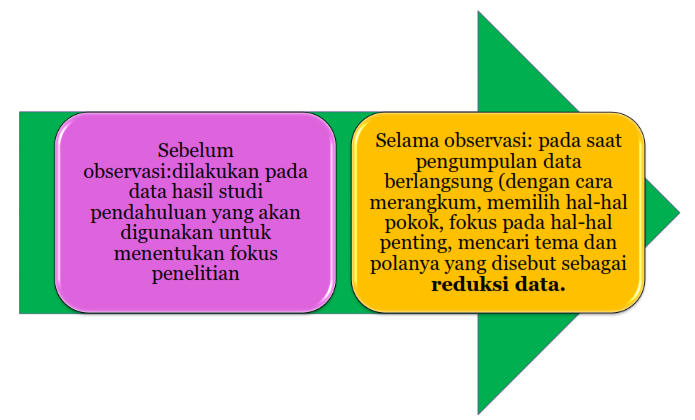
Interpretation of Data
Interpretation of research data is a form of activity to combine the results of an analysis with various kinds of questions, criteria, and to a certain standard in order to be able to create a meaning from the existence of data that someone has collected in order to find an answer to problems that exist in a study are currently being corrected.
The stages in data interpretation according to Poerwandari (2008) are:
1. Data organization
2. Coding / analysis
3. Creating a hypothesis and testing the hypothesis
4. Make conclusions
For more details, please open the link as follows:
-
Siswa harusTandai selesai
Quantitative data analysis methods are methods that depend on the ability to calculate data accurately. In addition, this method also requires the ability to interpret complex data. Some examples of quantitative analysis methods, such as descriptive analysis, regression, and factors. Quantitative data analysis methods have various types of analysis such as correlational techniques, regression, comparison, descriptive and the like.
Quantitative Research Assumptions
Quantitative research is based on the following assumptions (Nana Sudjana and Ibrahim, 2001; Del Siegle, 2005, and Johnson, 2005).
This method is an approach to data processing through statistical or mathematical methods which are collected from secondary data. The advantage of this method is a more measured and comprehensive conclusion. Other methods that can be used in the data analysis process are text analysis, statistical, diagnostic, predictive, prescriptive.
a. That the reality that is the target of research is single-dimensional, fragmental, and tends to be fixed so that it can be predicted.
b. Variables can be identified and measured by means of objective and standard.
Characteristics of Quantitative Research
The characteristics of quantitative research are as follows (Nana Sudjana and Ibrahim, 2001: 6-7; Suharsimi Arikunto, 2002: 11; Johnson, 2005; and Kasiram 2008: 149-150):
a. Using deductive thinking patterns (rational - empirical or top-down), which tries to understand a phenomenon by using general concepts to explain specific phenomena.
b. The logic used is positivistic logic and avoids things that are subjective.
c. The research process followed a planned procedure.
d. The purpose of quantitative research is to construct nomothetic science, namely science that seeks to make laws from its generalizations.
e. The subject under study, the data collected, and the source of the data needed, as well as the data collection tools used in accordance with what was planned beforehand.
f. Data collection is done through measurement using objective and standard tools.
g. Involves tallying numbers or quantifying data.
h. Researchers place themselves separately from the object of research, in the sense that they are not emotionally involved with the research subject.
i. Data analysis was performed after all data were collected.
j. In data analysis, researchers are required to understand statistical techniques.
k. The results of the study are in the form of generalizations and predictions, regardless of the context of time and situation.
l. Quantitative research is called scientific research
Quantitative Research Procedures
In practice, this research is based on a previously planned procedure. The quantitative research procedure consists of the following activity stages.
a. Identify the problem
b. Study of literature.
c. Development of a conceptual framework
d. Identification and definition of variables, hypotheses, and research questions.
e. Research design development.
f. Sampling technique.
g. Data collection and quantification.
h. Data analysis.
i. Interpretation and communication of research results.
Types of Quantitative Research
In conducting research, researchers can use certain methods and designs by considering the research objectives and the nature of the problems at hand. Based on the nature of the problem, quantitative research can be divided into several types as follows (Suryabrata, 2000: 15 and Sudarwan Danim and Darwis, 2003: 69 - 78).
a. Descriptive research
b. Correlational research
c. Comparative causal research
d. Action research
e. Developmental research
f. Experimental research
Quantitative Research Methods
The method used in quantitative research, especially quantitative analytic, is the deductive method. In this method a scientific theory that has been accepted as a truth is used as a reference in finding further truth.
Jujun S. Suriasumantri in his book Science in a Moral, Social, and Political Perspective (2000: 6) states that basically the scientific method is a way for science to acquire and organize its body of knowledge based on: a) a logical framework of thought with arguments that are consistent with knowledge previously compiled; b) describe the hypothesis which is the deduction of the said framework; and c) verify the hypothesis in question to test the truth of the statement factually.
Furthermore, Jujun stated that the scientific framework which is based on the logico-hypothetico-verification process basically consists of the following steps (Suriasumantri, 2005: 127-128).
a) The formulation of the problem, which is a question about an empirical object that has clear boundaries and can be identified the factors involved in it.
b) The preparation of a frame of mind in the formulation of hypotheses which is an argument that explains the possible relationships between various interrelated factors and forms a constellation of problems. This thinking framework is arranged rationally based on scientific premises that have been verified by taking into account the empirical factors that are relevant to the problem.
c) Formulation of hypotheses which are temporary or presumptive answers to the questions posed whose material is the conclusion of the developed frame of mind.
d) Hypothesis testing, which is the collection of facts relevant to the proposed hypothesis to show whether there are facts that support the hypothesis or not.
e) Drawing conclusions which is an assessment of whether the proposed hypothesis is rejected or accepted.
The steps or research procedures were then visualized by Jujun S. Suriasumantri in chart form as follows:

For more details, please see the following shows:
-
Siswa harusTandai selesai
This data analysis method is a method using interviews and observations by answering questions like what, why or how. The data analyzed by this method is in the form of text or narrative. Furthermore, from the overall data, a classification process is carried out based on the needs with a coding process. The last stage in this method is data interpretation. The actual data interpretation process is carried out simultaneously during coding. Interpretation attempts were made simultaneously in classifying the data. Interpretation step to analyze data to produce the required information.
This method requires a more subjective approach to data. Qualitative data analysis method is a method of in-depth data processing with data from observations, interviews, and literature. The advantage of this method is the depth of the analysis results. On the other hand, this is the added value of the qualitative analysis method, in which the analyst plays an important role in the analysis process as part of the research tool.
What is meant by qualitative analysis is a job that aims to investigate and determine the content of the compounds contained in a test sample. This qualitative analysis is carried out using standard testing techniques in the laboratory.
The method used in conducting this qualitative analysis test can be in the form of classical methods or using sophisticated instruments. The most important classical test method is color analysis or color reaction.
By burning the test compound and then seeing the specific flame color produced, it can be seen the compounds contained therein. Both methods are preliminary tests.
This method can be used for inorganic compounds both cations, anions, or also for organic compounds such as phytochemical screening techniques in the selection of plant secondary metabolites. Another qualitative analysis method that can be used to determine the substance content is the flame color test.
Using Instrument
In the use of analytical instruments, it is usually known that in today's times, it can perform various qualitative analyzes depending on the specifications of the instrument.
For example: Variable Consumer Behavior, which measures consumer behavior (based on theory) consists of: cultural, social, personal, psychological factors, and purchase decisions
Qualitative Research Characteristics
1. The data collected is in the original condition or natural (natural setting).
2. The researcher acts as a research tool, meaning that the researcher is the main tool for collecting data / as an observer of the interview.
3. As much data as possible were collected descriptively, which was then written in the form of a report.
4. Qualitative research is more concerned with process than results.
5. The background of behavior or actions is searched for meaning.
6. Using the method triangulation method or data triangulation.
7. Concerned with contextual details.
Types of Qualitative Data Analysis
In general, data analysis methods include reduction, data display and data conclusions or verification. However, because there are so many caulitative data, the data analysis model also varies according to the object of research. In general, the data analysis model is divided into three groups: first, the text and language analysis methods group; second, the analysis method group for cultural themes; third, group analysis of performance, individual behavior and institutional behavior [11].
The parts of the three groups of qualitative data analysis models above are as follows [12]:
1. Group of text and language analysis methods
a) Content analysis (this analysis)
b) Framing analysis (Frame analysis)
c) Semiotic analysis
d) Analysis of mass social media construction
e) Hermeneutic
f) Discourse analysis and text interpretation
g) Critical discourse analysis
2. Group analysis of cultural themes
a) Structural analysis
b) Domain analysis
c) Taxonomy analysis
d) Componential analysis
e) Discovering cultural theme analysis
f) Constant comparative analysis
g) Grounded analysis
h) Ethnology
3. Group performance analysis and individual experiences and institutional behavior
a) Focus group discussion (FGD)
b) Case studies
c) Biographical techniques
d) Life's history
e) SWOT analysis
f) Use of documentary materials
g) Use of visual materials
Source:(1) William J. Goode dan Paul K. Hatt, Methods in social research, Kogakusa: McGraw-Hill Book Company, 1981
(2) Sugiyono, Metode Penelitian Kuantitatif dan Kualitatif Dan R & D, (Bandung : Alfabeta, 2009), hlm. 338.
http://
http:// -
Siswa harusTandai selesai
The difference between qualitative and quantitative research can be seen from several aspects. Not always contradicting each other, there are also those who have similarities or similarities between the two.
1. Qualitative is general, flexible, and dynamic.
2. Quantitative has a specific, detailed and static nature. The flow of quantitative research itself was planned from the start and cannot be changed.
Data analysis
- Qualitative can be analyzed during the research process.
- Quantitative can be analyzed at a final stage prior to reporting.
Research Subject Terms
- Qualitative research subjects are usually referred to as sources.
- Quantitative has research subjects who are commonly referred to as respondents.
- Look at the Facts
- Qualitative: Qualitative research views "Facts / Truth" depending on how the researcher interprets the data. This is because there are complex things that cannot be explained simply by numbers, such as human feelings.
- Quantitative: Quantitative research views "Facts / Truth" as being the object of research out there. Researchers must be neutral and impartial.
Data collection
- Qualitative: Qualitative research focuses more on something that cannot be measured by black and white truth, so that in qualitative research the researcher digs deep into the data on certain things.
- Quantitative: Data collection was carried out using a series of research instruments in the form of tests / questionnaires.
Data Representation
- Qualitative: The results of qualitative research are in the form of the researcher 's interpretation of a phenomenon, so that the research report will contain more descriptions.
- Quantitative: The results of quantitative research are presented in the form of mathematical calculation results. The results of the calculation are considered as confirmed facts.
Implications of Research Results
- Qualitative: The results of qualitative research have a limited impact or effect on a particular situation. So that the results of this study cannot be concluded in different settings.
- Quantitative: The results of quantitative research are generalized facts / theories. Whenever and wherever, this fact applies.
Kinds of Methods
- Qualitative: Phenomenology, ethnography, case studies, historical, grounded theory.
- Quantitative: Experiment, survey, correlation, regression, path analysis, ex post facto.
Research purposes
- Qualitative: gain deep understanding, develop theory, describe reality and social complexity.
- Quantitative: Explaining the relationship between variables, testing the theory, generalizing the social phenomena under study.
Type of Data
- Qualitative: qualitative research is in the form of descriptive or describes the phenomenon or research facts as they are.
- Quantitative: data types that are numeric or numeric. In addition, it is also in the form of statistics, namely data that has been grouped so that it can provide information about a problem or symptom.
Some summaries of the differences between quantitative and qualitative research are as follows:

- Qualitative Research
Purpose: subject approach, sample, data source, flexible research steps can change and develop as you go along.- Quantitative Research
Purpose: subject approach, sample, research steps, data sources are clear.
- Qualitative Research:
- Watching participates in trying to find meaning. Must go directly to make participants active in the respondent's life.
- Do it objectively
- Record data and with facts.
- Recording must be done in a formal and thorough and consistent with the objectives of the researcher.
- The existing phenomena must be seen from the context, both in terms of function and structure.
- More to case studies in the field, for example ethnographic issues, and so on.
Quantitative Research:
- The quantitative approach emphasizes the results of the existing diversity averages
- The way of thinking in analyzing with a qualitative approach emphasizes logic, which looks for mistakes.
- Quantitative:
- Is viewed as exploratory and inductive.
- Measuring facts. The focus on reliability / reliability is key
- Separate theory and data
- In a free context
- The case of many subjects
- Not involved- Qualitative Research:
Is a collection of data in a natural setting with the intention of interpreting the phenomena that occur where research is a key instrument, sampling of data sources is done purposively and snowball.- Quantitative Research:
Retrieval of data is available because it has experienced continuous previous treatment. Thus the sample was taken through a questionnaire, which then the data was processed statistically in accordance with the research objectives.
- Qualitative Research:
- Build social reality, cultural meaning
- Focus on Interactive process activities
- Intensity is key
- Present and explicit values
- Theory and data converge
- Restricted situation
- Few subject cases
- Related systematic analysis
- Researchers are involved.
- Quantitative Research:
- Make generalizations in making conclusions for a population whose samples have been homogenized through the appropriate sampling method.
- Researchers collect data that is already available so that the involvement of researchers is not really needed in the field.
- Qualitative Research:
- An effective thing
- Reality variables can be identified and measured
- Research is independent from the object of observation
- Quantitative Research
- Reality is a social form
- variables are relatively difficult to measure, complex and interconnected - the researcher relates directly to the object or participant being observed.
- Qualitative Research:
- Hypotheses are developed in line with research or research momentary.
- Definition according to the context or when the researcher is ongoing
- Narrative descriptions or words of phrases or statements
- Prefer to assume sufficient reliability of collection
- The validity assessment corresponds to cross-checking of information sources
- Use descriptions narrative
- Quantitative research:
- Using a hypothesis determined from the beginning of the researcher
- A clear definition was stated from the start
- Reduce data to numbers
- Pay more attention to the reliability of the scores obtained through the research instrument
- assessment of validity using various procedures relying on statistical counts
- use a clear (current) procedure description
-
-
-
Siswa harusTandai selesai
Bibliometric analysis is a quantitative method for analyzing bibliographic data in articles/journals. This analysis is usually used to investigate references to scientific articles cited in a journal, to map the scientific fields of a journal, and to classify scientific articles according to a research field.
This method can be used in the fields of sociology, humanities, communication, marketing, and other social groups. The approach used in bibliometric analysis is a citation analysis approach to see 1 article cited by 1 other article, and a co-citation analysis approach to find 2 or more articles cited by 1 article.
It can be concluded that Bibliometrics is a science that examines authorship using mathematical and statistical analysis. With this knowledge we will know things about authorship, one of which is the productivity of the author. An author can be judged as productive or not by looking at the number of works he has written in a certain period of time, whether they are his own work without the need for other writers, or the result of collaboration between writers.
Benefits of Bibliometric Analysis
According to Ishak (2005), some of the benefits of bibliometrics in the library are as follows:
1. Knowing core magazines in various disciplines
2. Knowing the direction and trend of science in various disciplines
3. Estimating whether or not the secondary literature is complete
4. Know the subjects or fields of the discipline
5. Knowing authorship
6. Predicting the direction of scientific development in the past and the future
7. Manage the incoming flow of information and communication
8. Review the obsolescence and dissemination of scientific literature
9. Forecast the productivity of publishers of authors, organizations, countries or all disciplines.
Types of bibliometric analysis
Here are some common bibliometric measures:
ΓÇó Number of citations: the number of times the research output appears in reference lists of other documents (articles, books, reviews, conference proceedings, etc.). Found in: Google Scholar, Scopus, and Web of Science.
ΓÇó H-Index: designed to measure author productivity and impact. This is the number of publications by the author (h) that have h or more citations. Found in: Google Scholar, Scopus, and Web of Science.
ΓÇó Field-weighted citation impact: ratio of citations received relative to expected world average for subject area, type of publication and year of publication. This can be applied to research outputs or groups of research outputs. Found on SciVal.
ΓÇó Output in top percentile: the amount or percentage of research output in the most cited publications in the world, UK or a given country. Found on Scopus and SciVal.
ΓÇó Journal Impact Factor: based on the average number of citations received per paper published in that journal in the previous two years. Found in Journal Citation Reports.
ΓÇó CiteScore: the average number of citations received in a calendar year across all items published in that journal over the next three years. Found on Scopus
ΓÇó SCImago Journal Rating: gives higher scores to citations from more prestigious journals. Found on Scopus
ΓÇó Scopus SNIP: ratio of the number of journal citations per paper and potential citations in the subject area. Scopus SNIP normalizes citation rate subject differences. Found on Scopus.
(Adapted from Metrics Toolkit licensed under the CC-BY 4.0 license.)
Bibliometric Software
Some of the uses of software in conducting bibliometric analysis include:
1. Vosviewer
2. HistCit,
3. BibExcel,
4. Tax,
5. Sci2,
6. Cytoscape
7. Gephy
Some software related to Bibliometrics, namely:
1. Scopus (scopus.com)
Actually, this is not software, but rather a kind of information system. Or more accurately referred to as an indexer.
Scopus, with a certain mechanism indexes various journals. Of course using the method and there are conditions. The index results are processed, then after being cooked, then eaten and served. This Scopus data is not free, but must be redeemed in dollars. The information contains performance journals, articles, countries, researchers. Includes networking info and more.
2. ScimagoJR (scimagojr.com)
Scimago Journal Rank (SJR) retrieves data from Scopus, then processes it again. Processed numbers are used to rank journals. At Scimago, the term Q, aka Quartile, is known. There are Q1,2,3,4. This means that the journal ranking is divided by 4. The lowest quarter, the quarter above it, the quarter above it again, and the top quarter.
3. PoP (https://harzing.com/resources/publish-or-perish)
Publish or Perish (PoP). This term is well known: rise or die. But this PoP is also the name of a software. PoP can retrieve data from Google Scholar (google scholar) and display and store it.
Source: (Adapted from Metrics Toolkit licensed under the CC-BY 4.0 license.)
Guide to Using Vosviewer In carrying out Bibliometric (Systematic Literature) analysis, you can see the PDF files and videos at the following links:
-
Siswa harusTandai selesaiKindly download the file
-
-
-
Siswa harusTandai selesai
How are you all, after nearly 4 months (16 meetings) we discussed a lot about methodological research materials, so for this UAS you are asked to be able to draft a thesis proposal With the following format:
Title Chapter 1 Introduction Background, Problem Formulation, Research Objectives, Research Benefits, Writing Systematics
Chapter 2: Theoretical Basis Theories, Prior Research (table mapping of previous research), Frameworks. Hypothesis
Chapter 3: Research Methodology Research Type, Research Source, Data Collection Method, Population and Sample, Data Analysis References
This Draft Proposal must be submitted via LMS from .......by including a cover that includes the name of the NPM, title and logo in the form of a word version (not Pdf) soft file format. Good luck and happy work, thank you
-
 and
and  , with its elements expressed in lower-case (e.g.,
  ) and the sample size denoted by the letter
  .
.